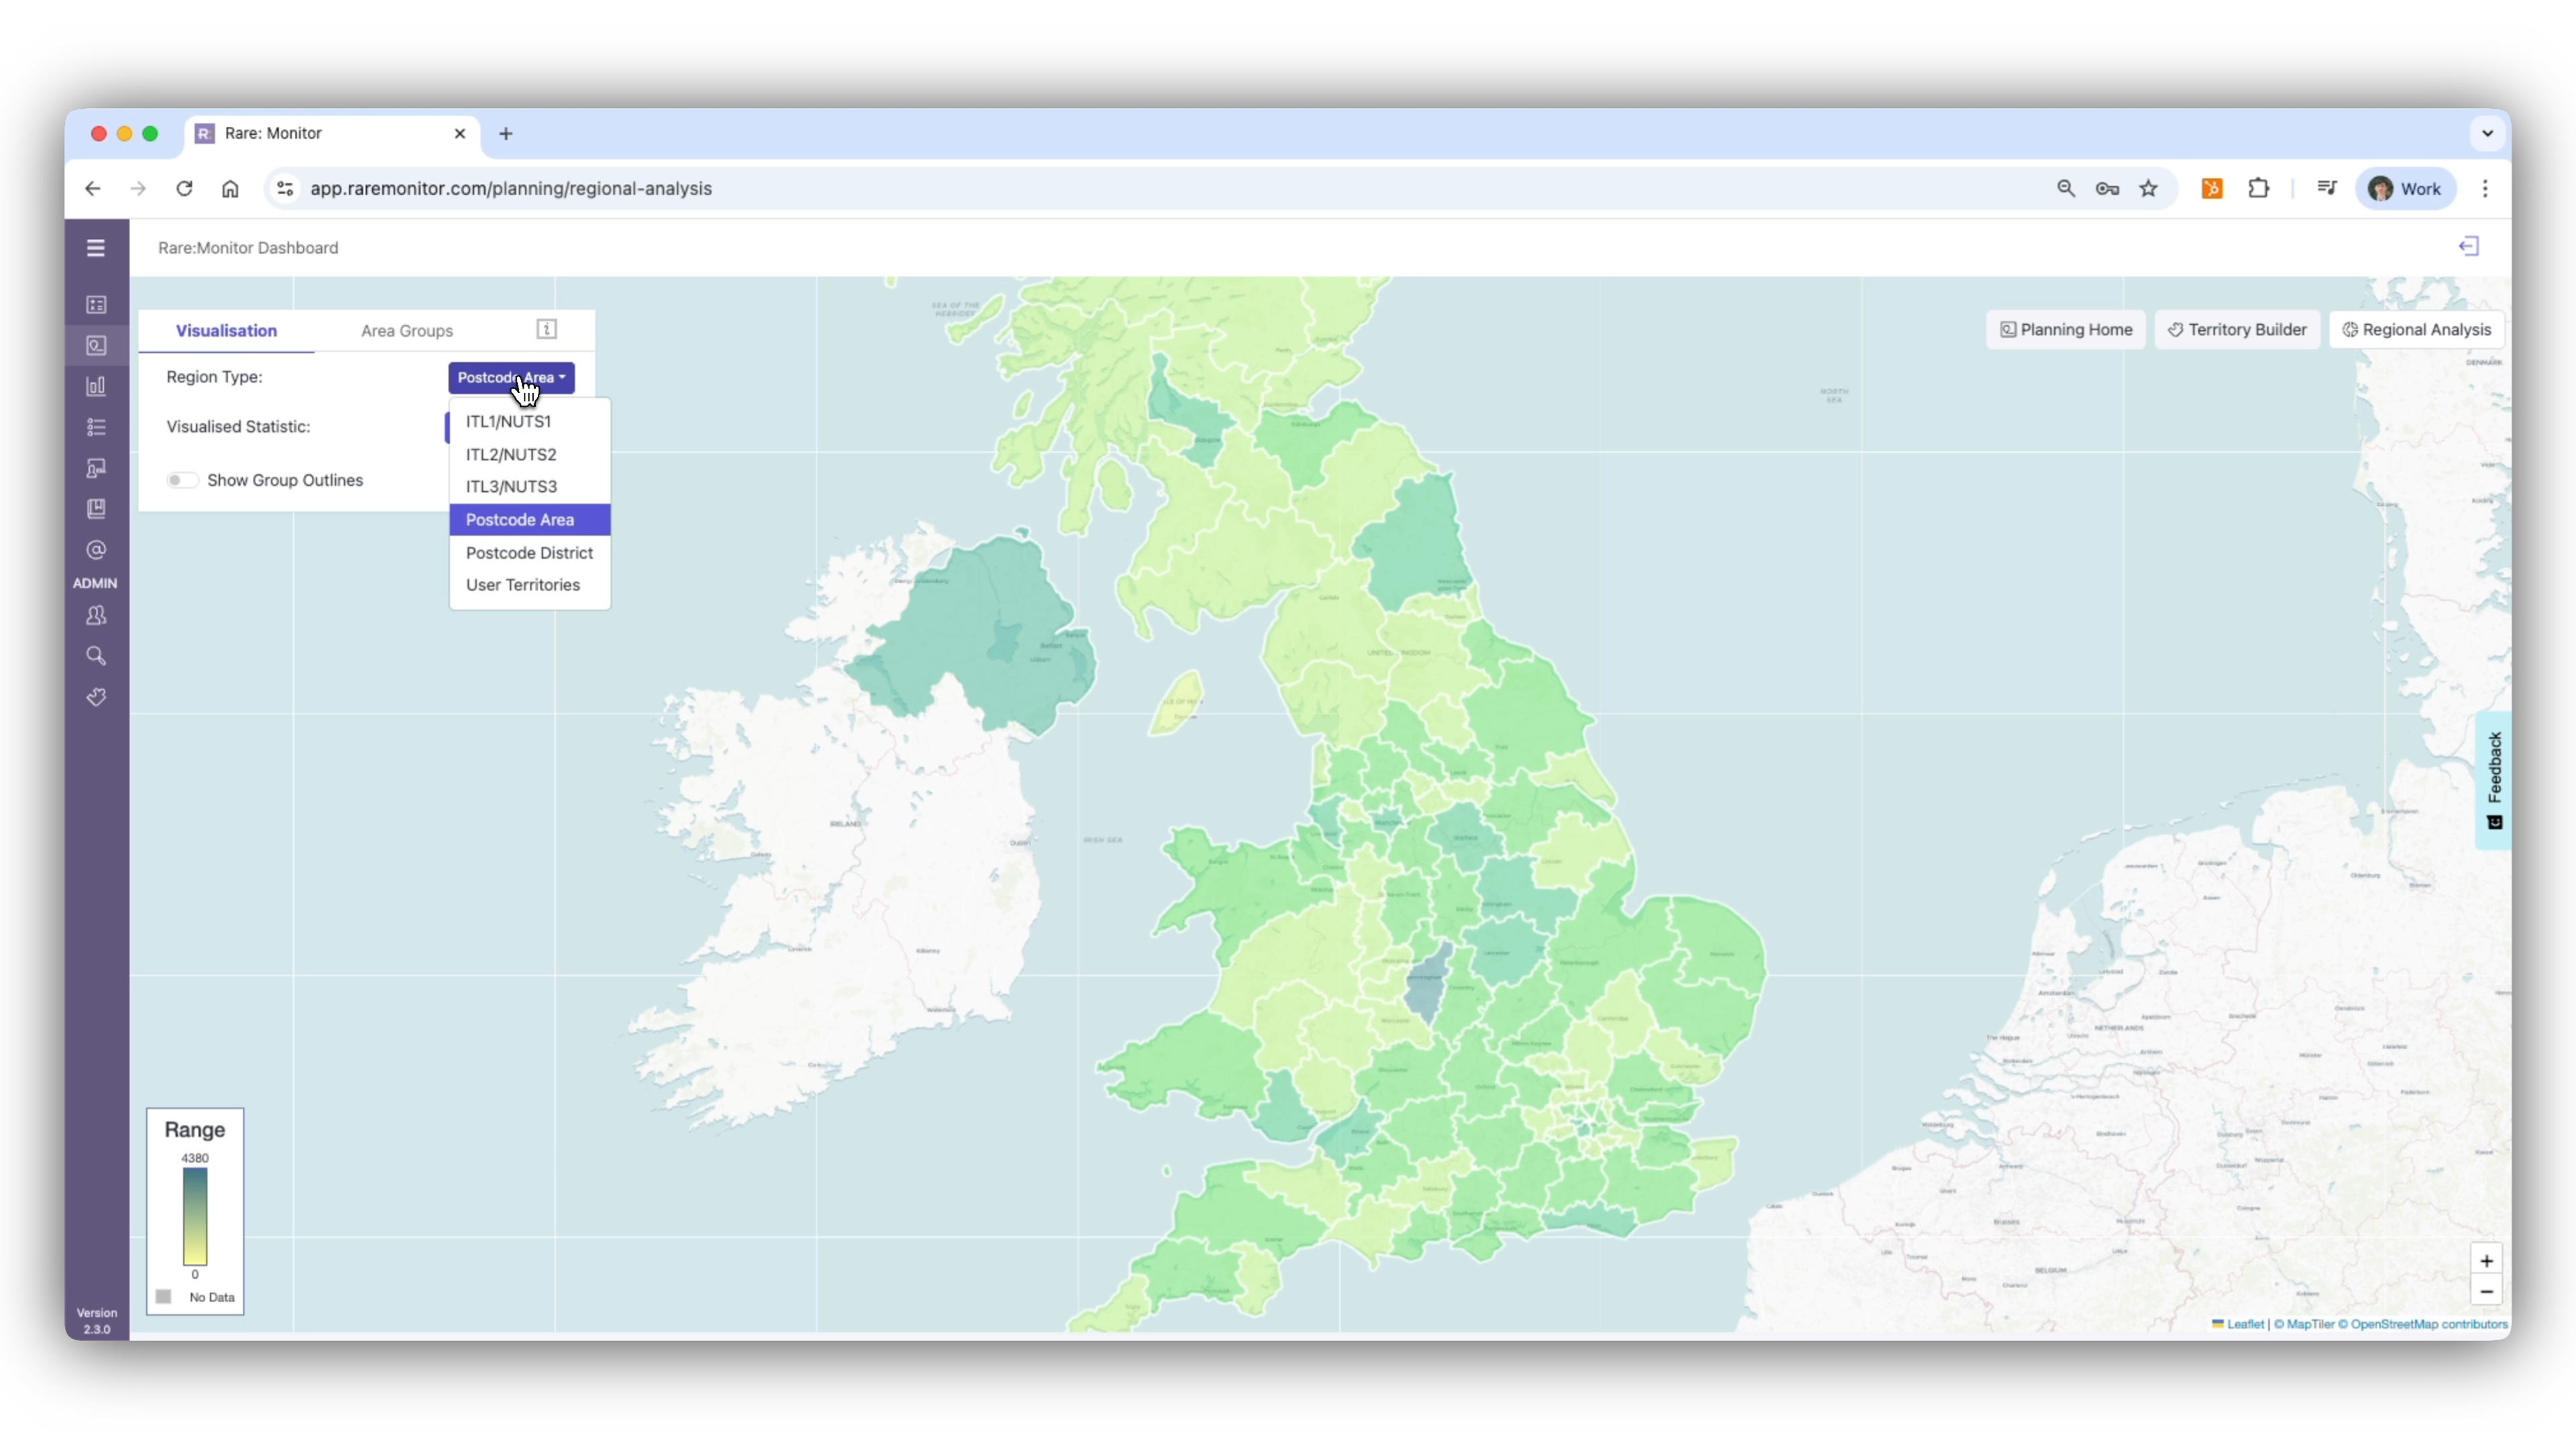
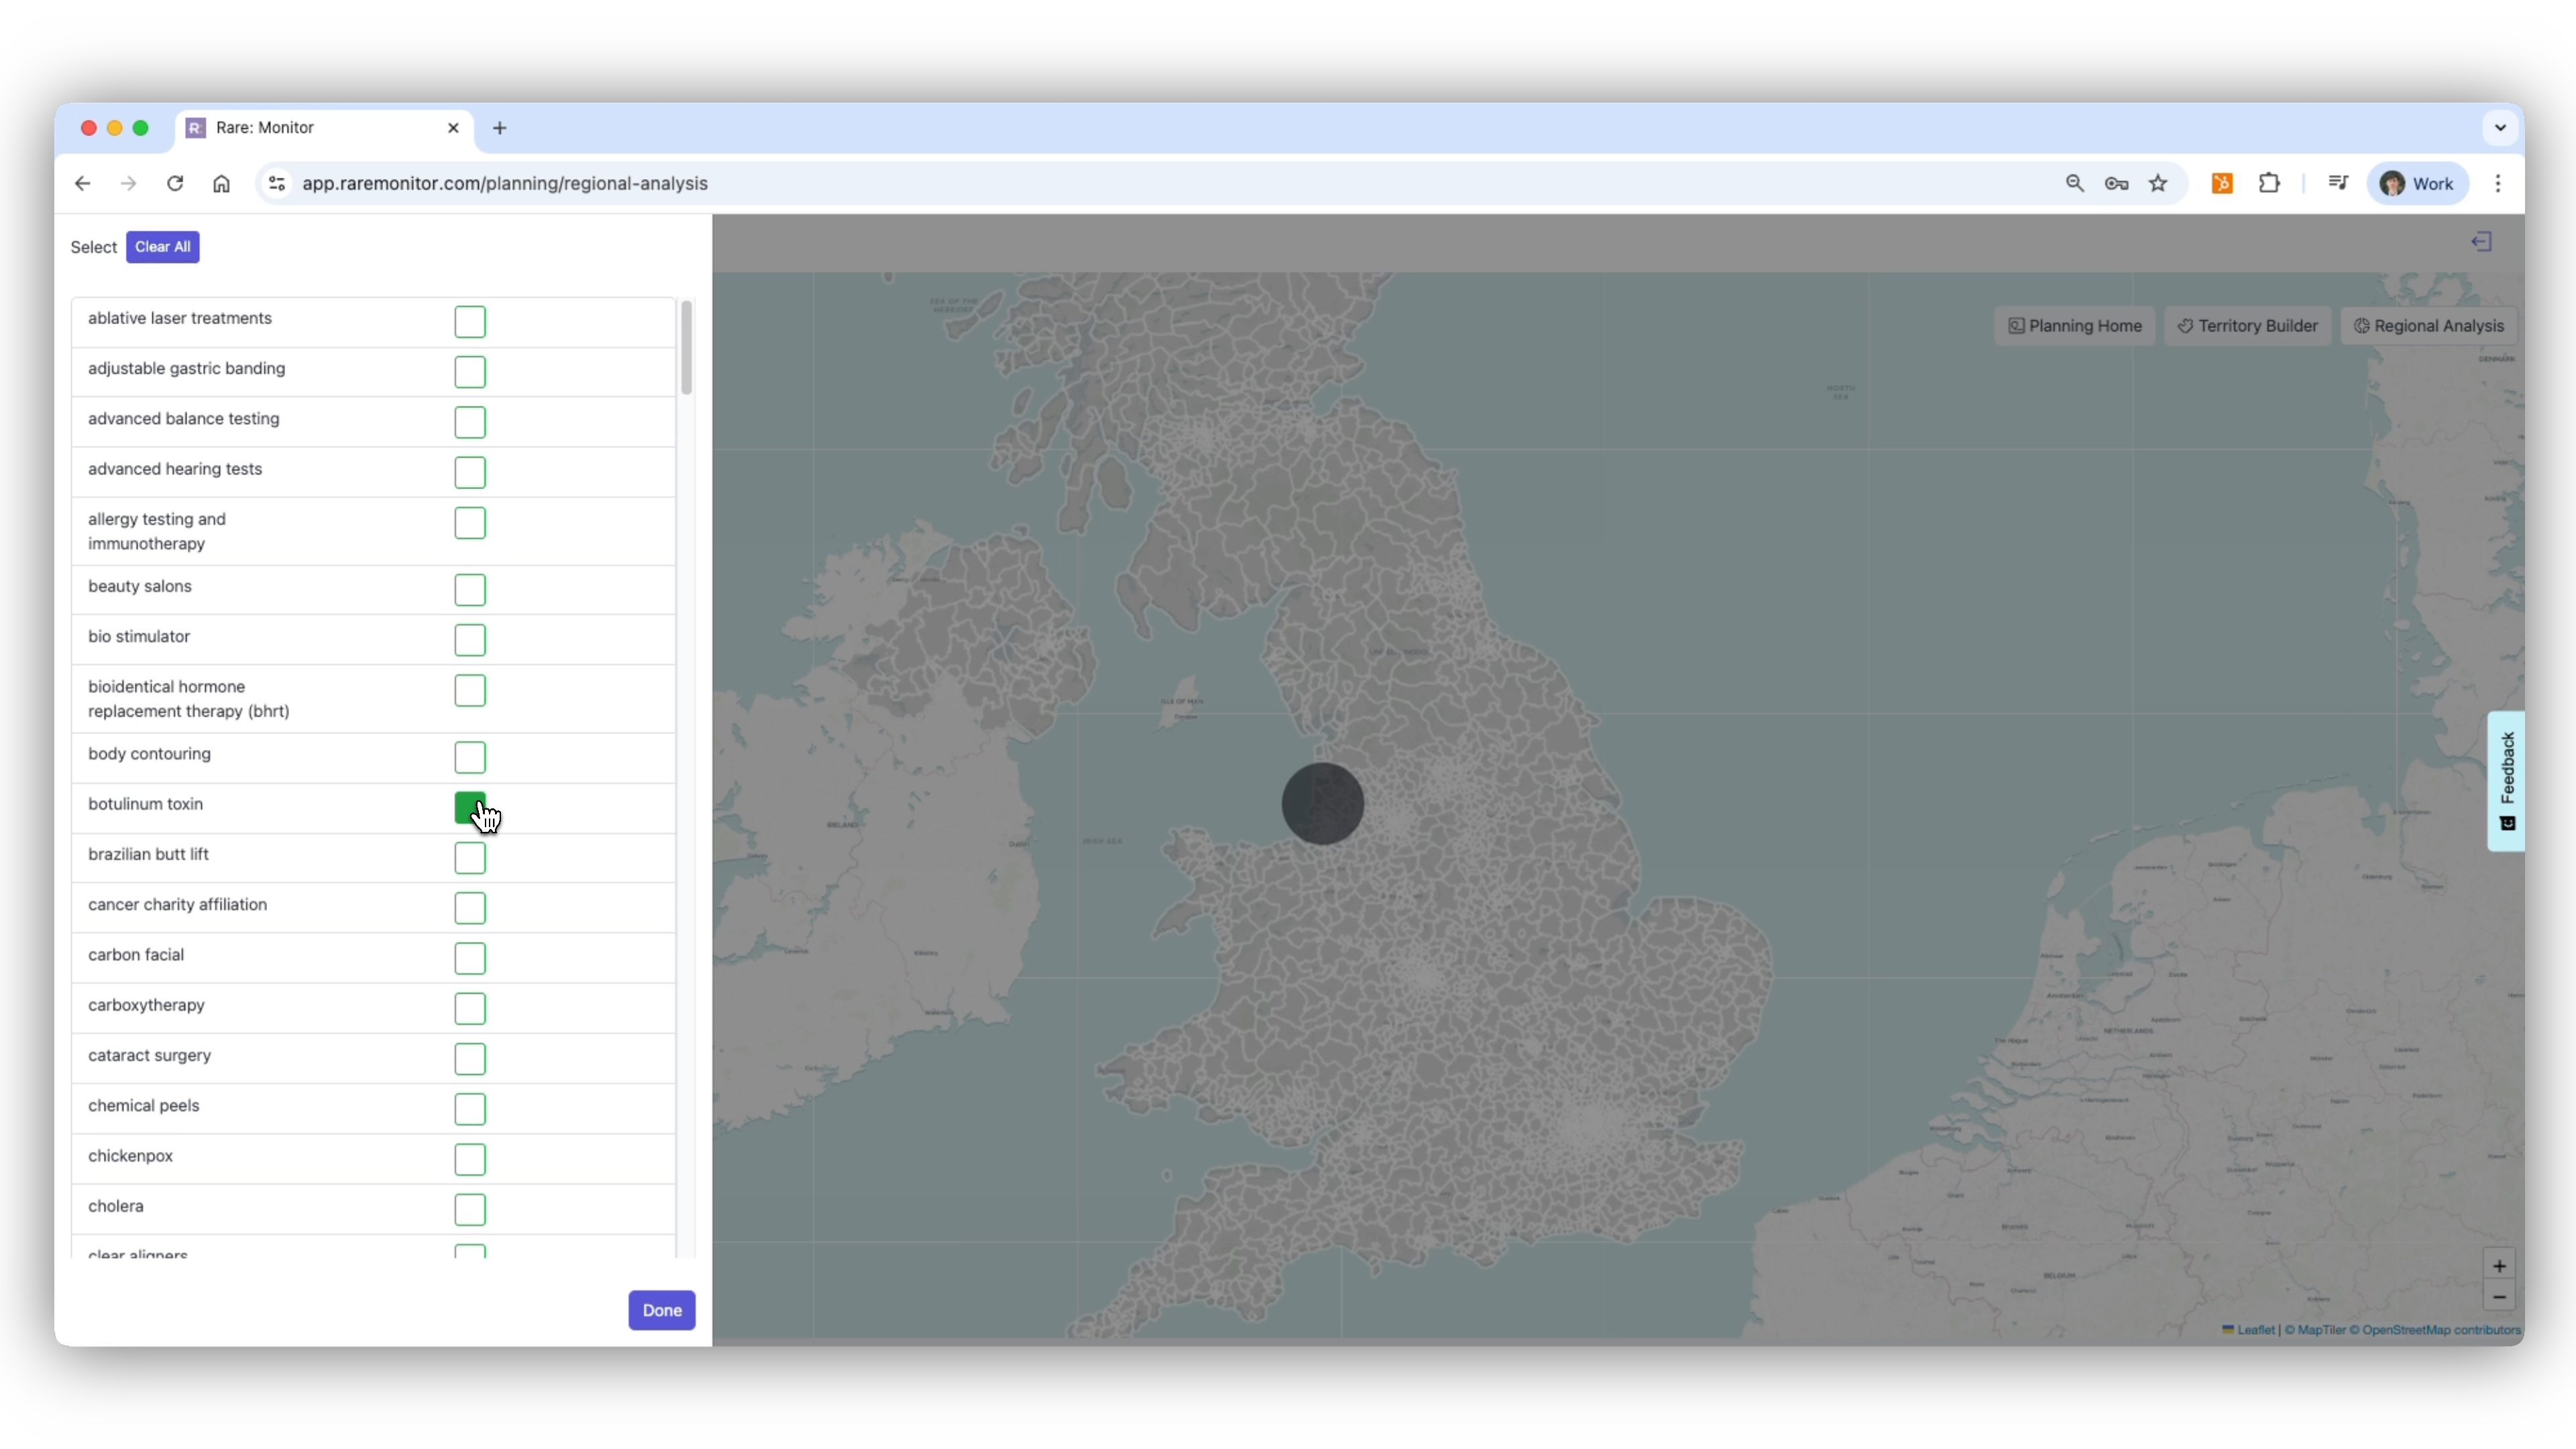
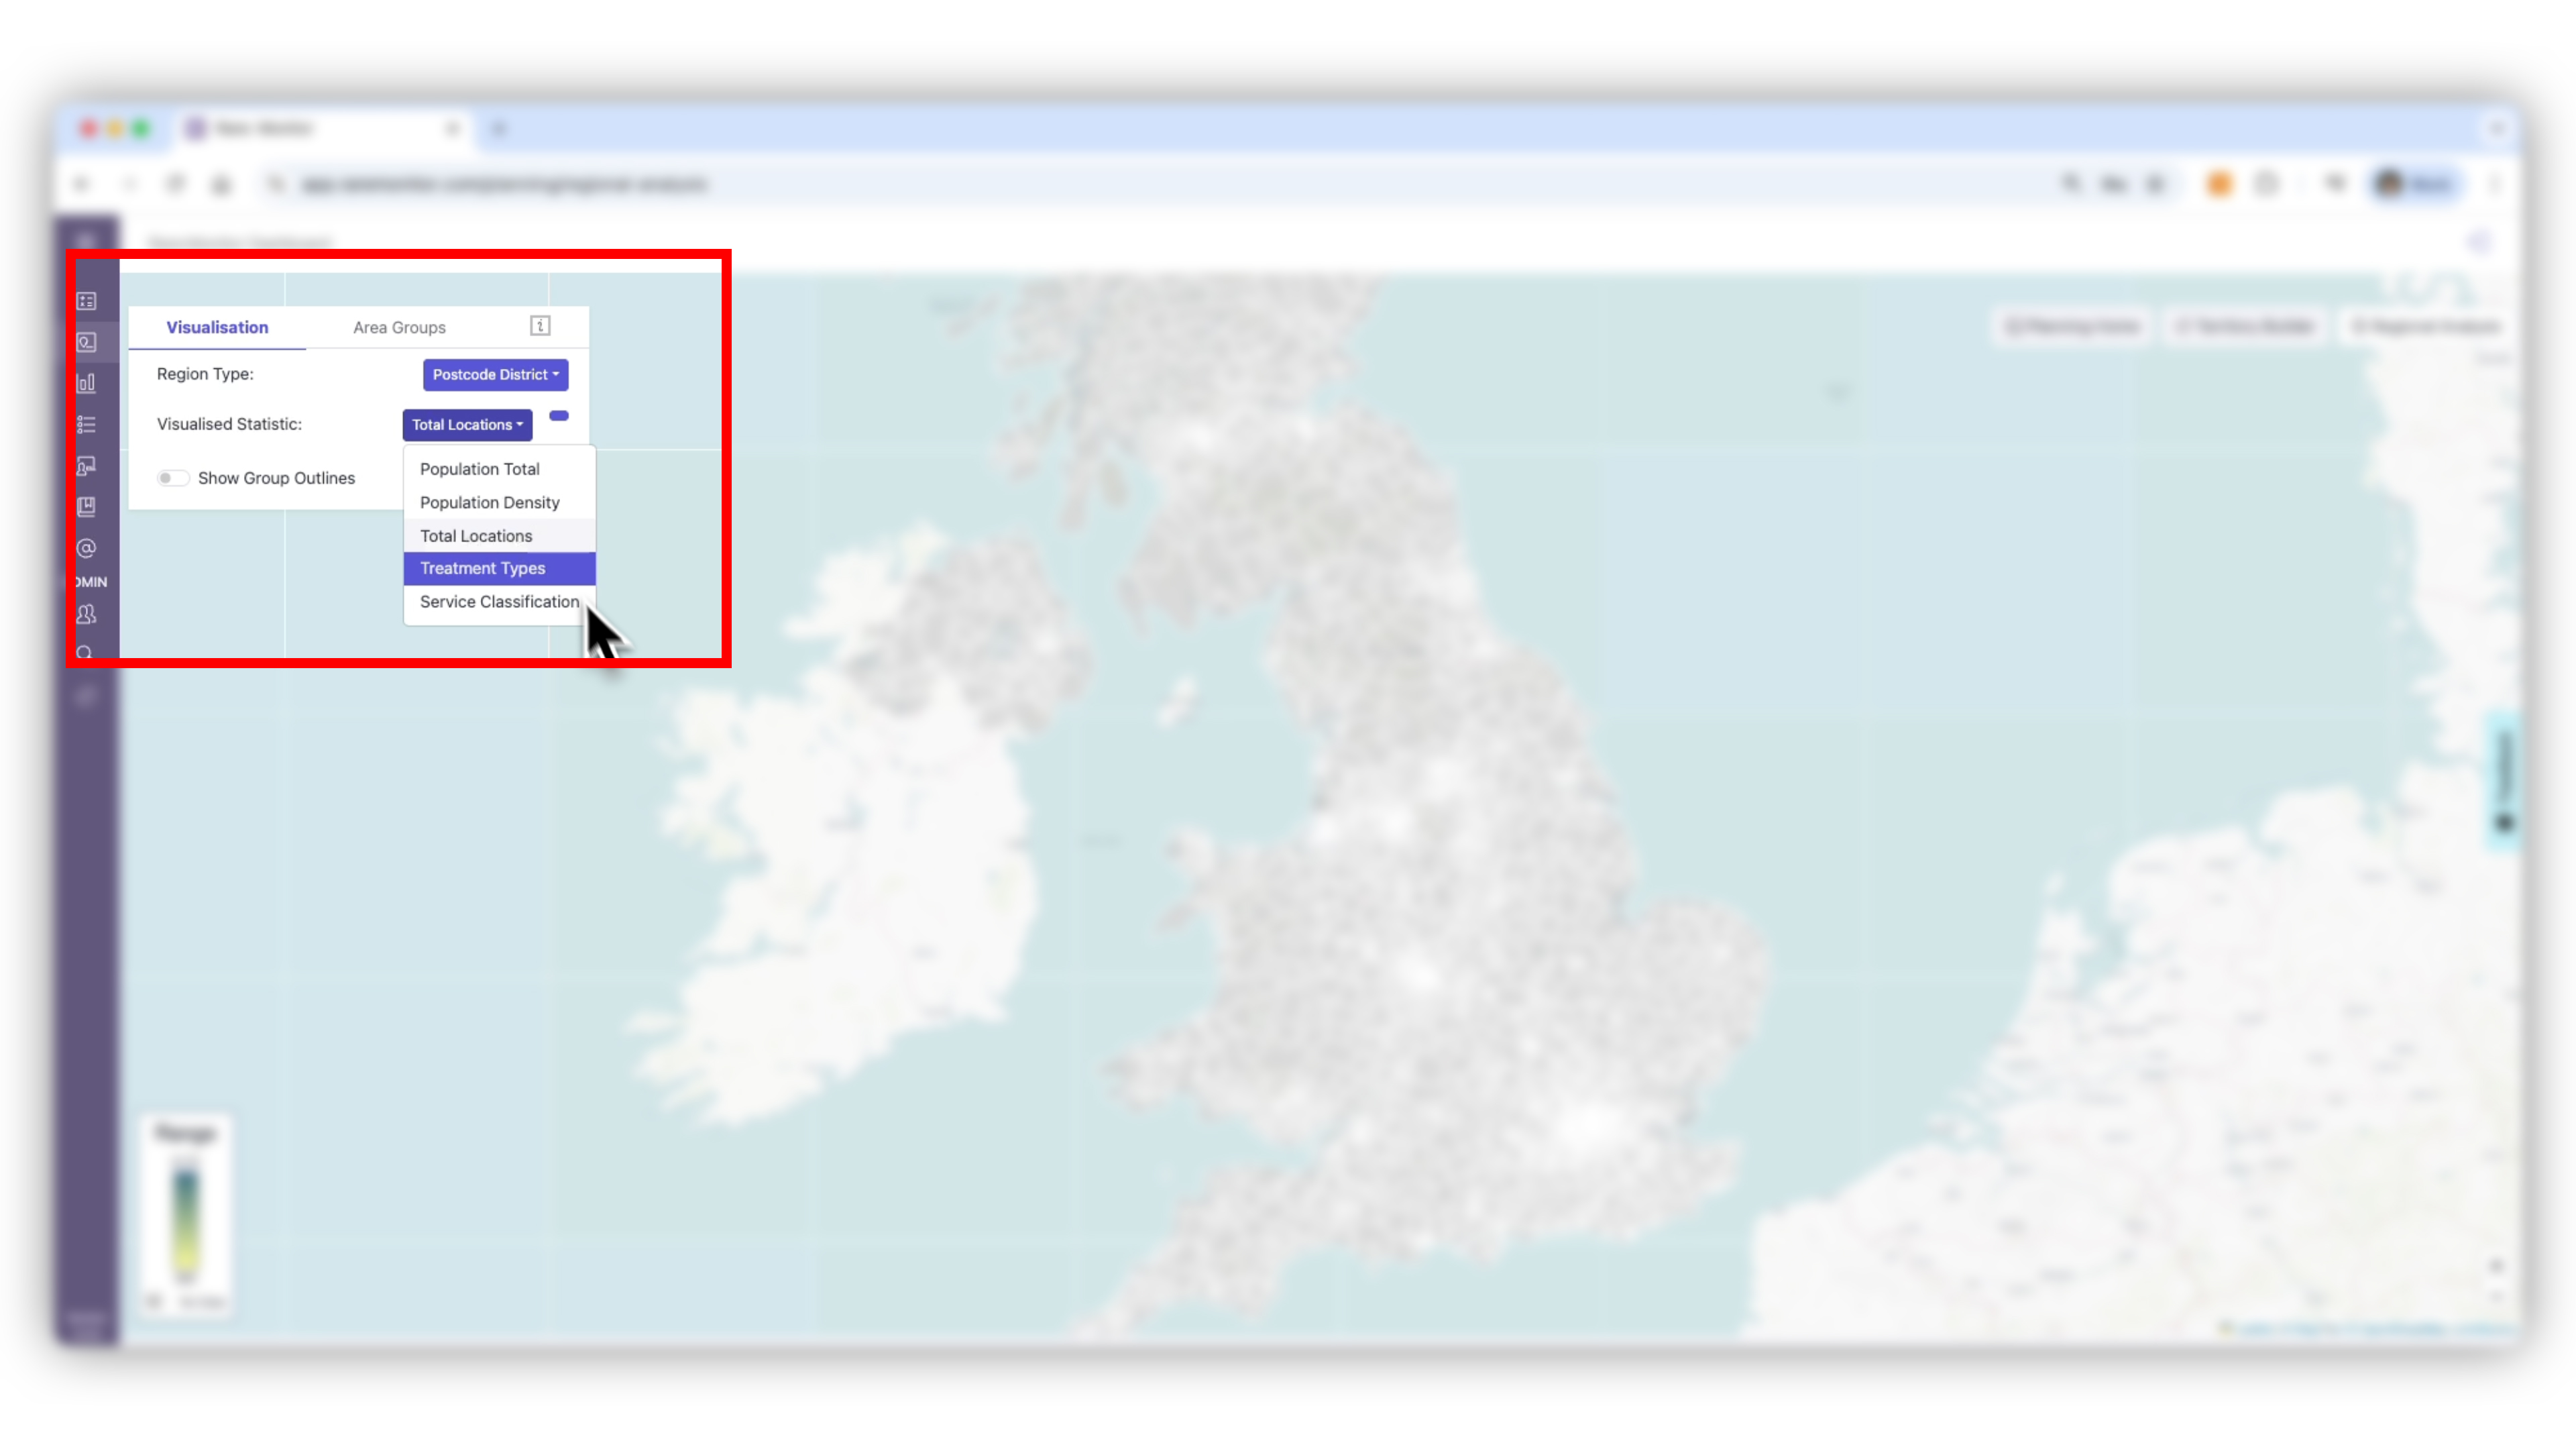
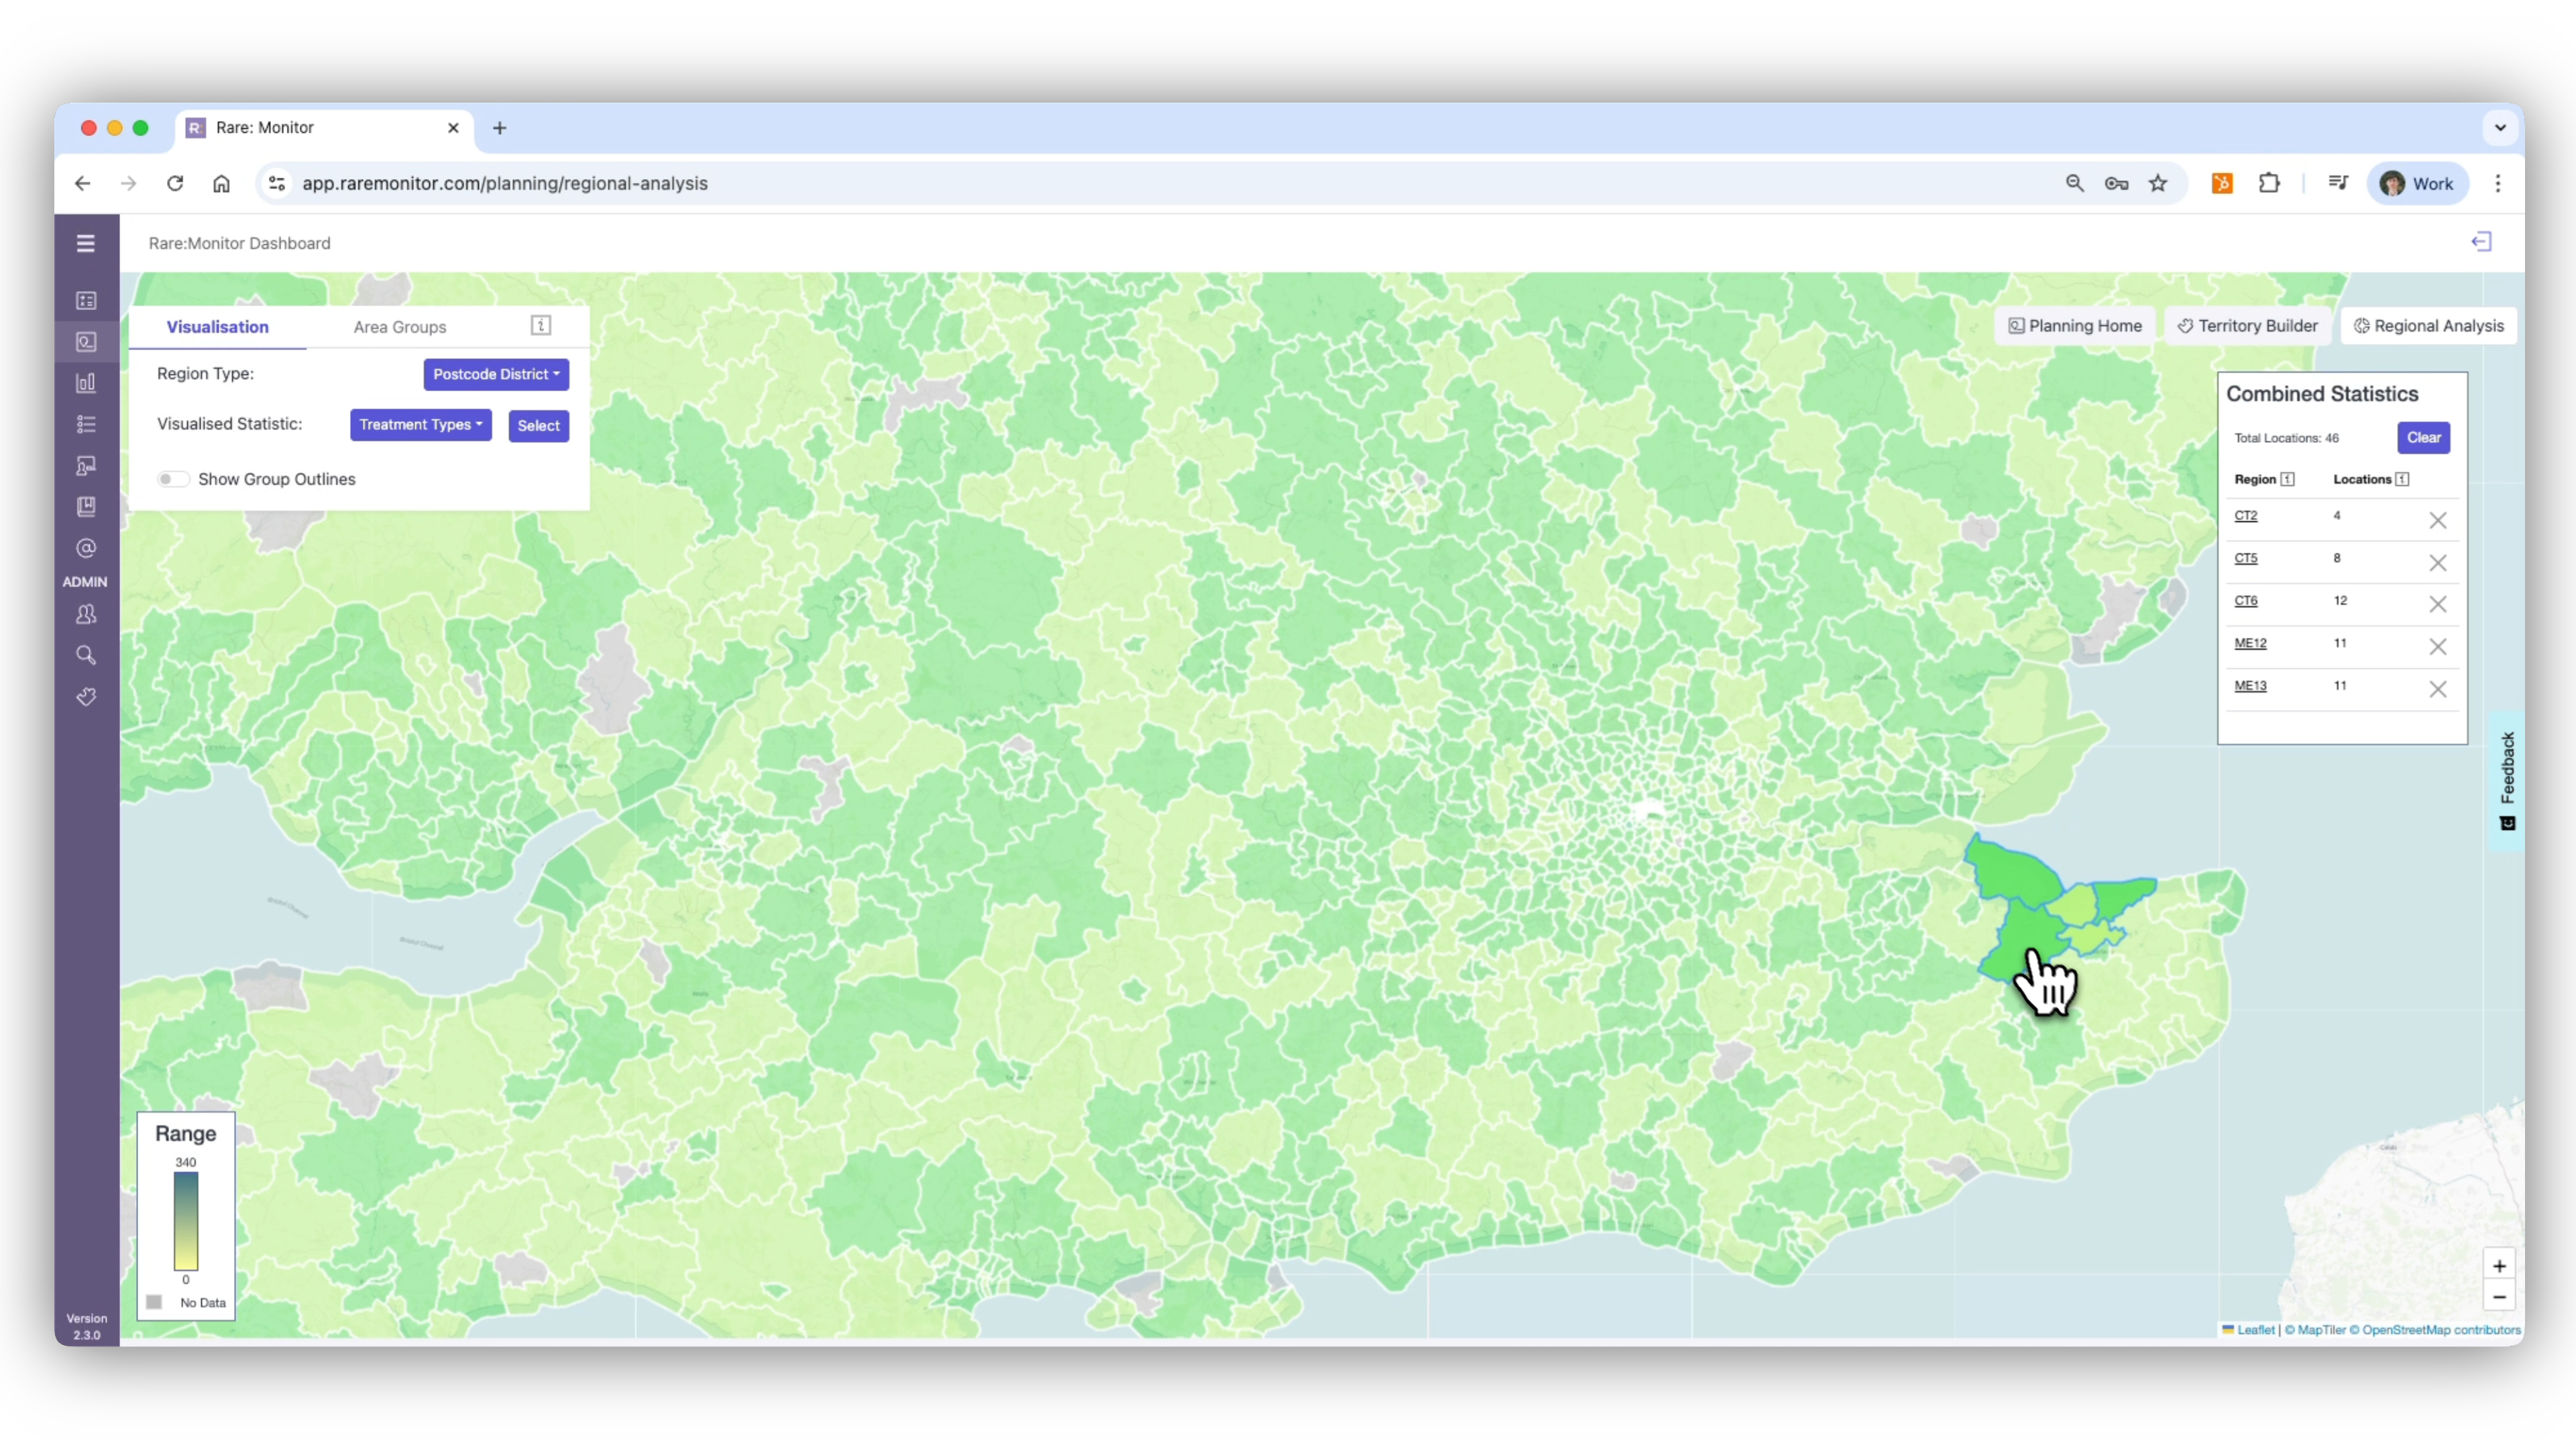
Regional Analysis is Rare.Monitor's view of the UK as a heatmap. By the end of this lesson you'll know how to switch between geographic segmentations (NUTS 1, NUTS 2, NUTS 3, postcode districts), overlay your existing territories, and compare regions by population, treatment availability, or clinic density.
01
02
03
04
Next: Create Training Courses & Modules. With the geography sorted, the next lesson moves to how Monitor tracks training activity, and links it to sales analytics.
01
The fastest path from your account credentials to your first prospect list.
4 min video
02
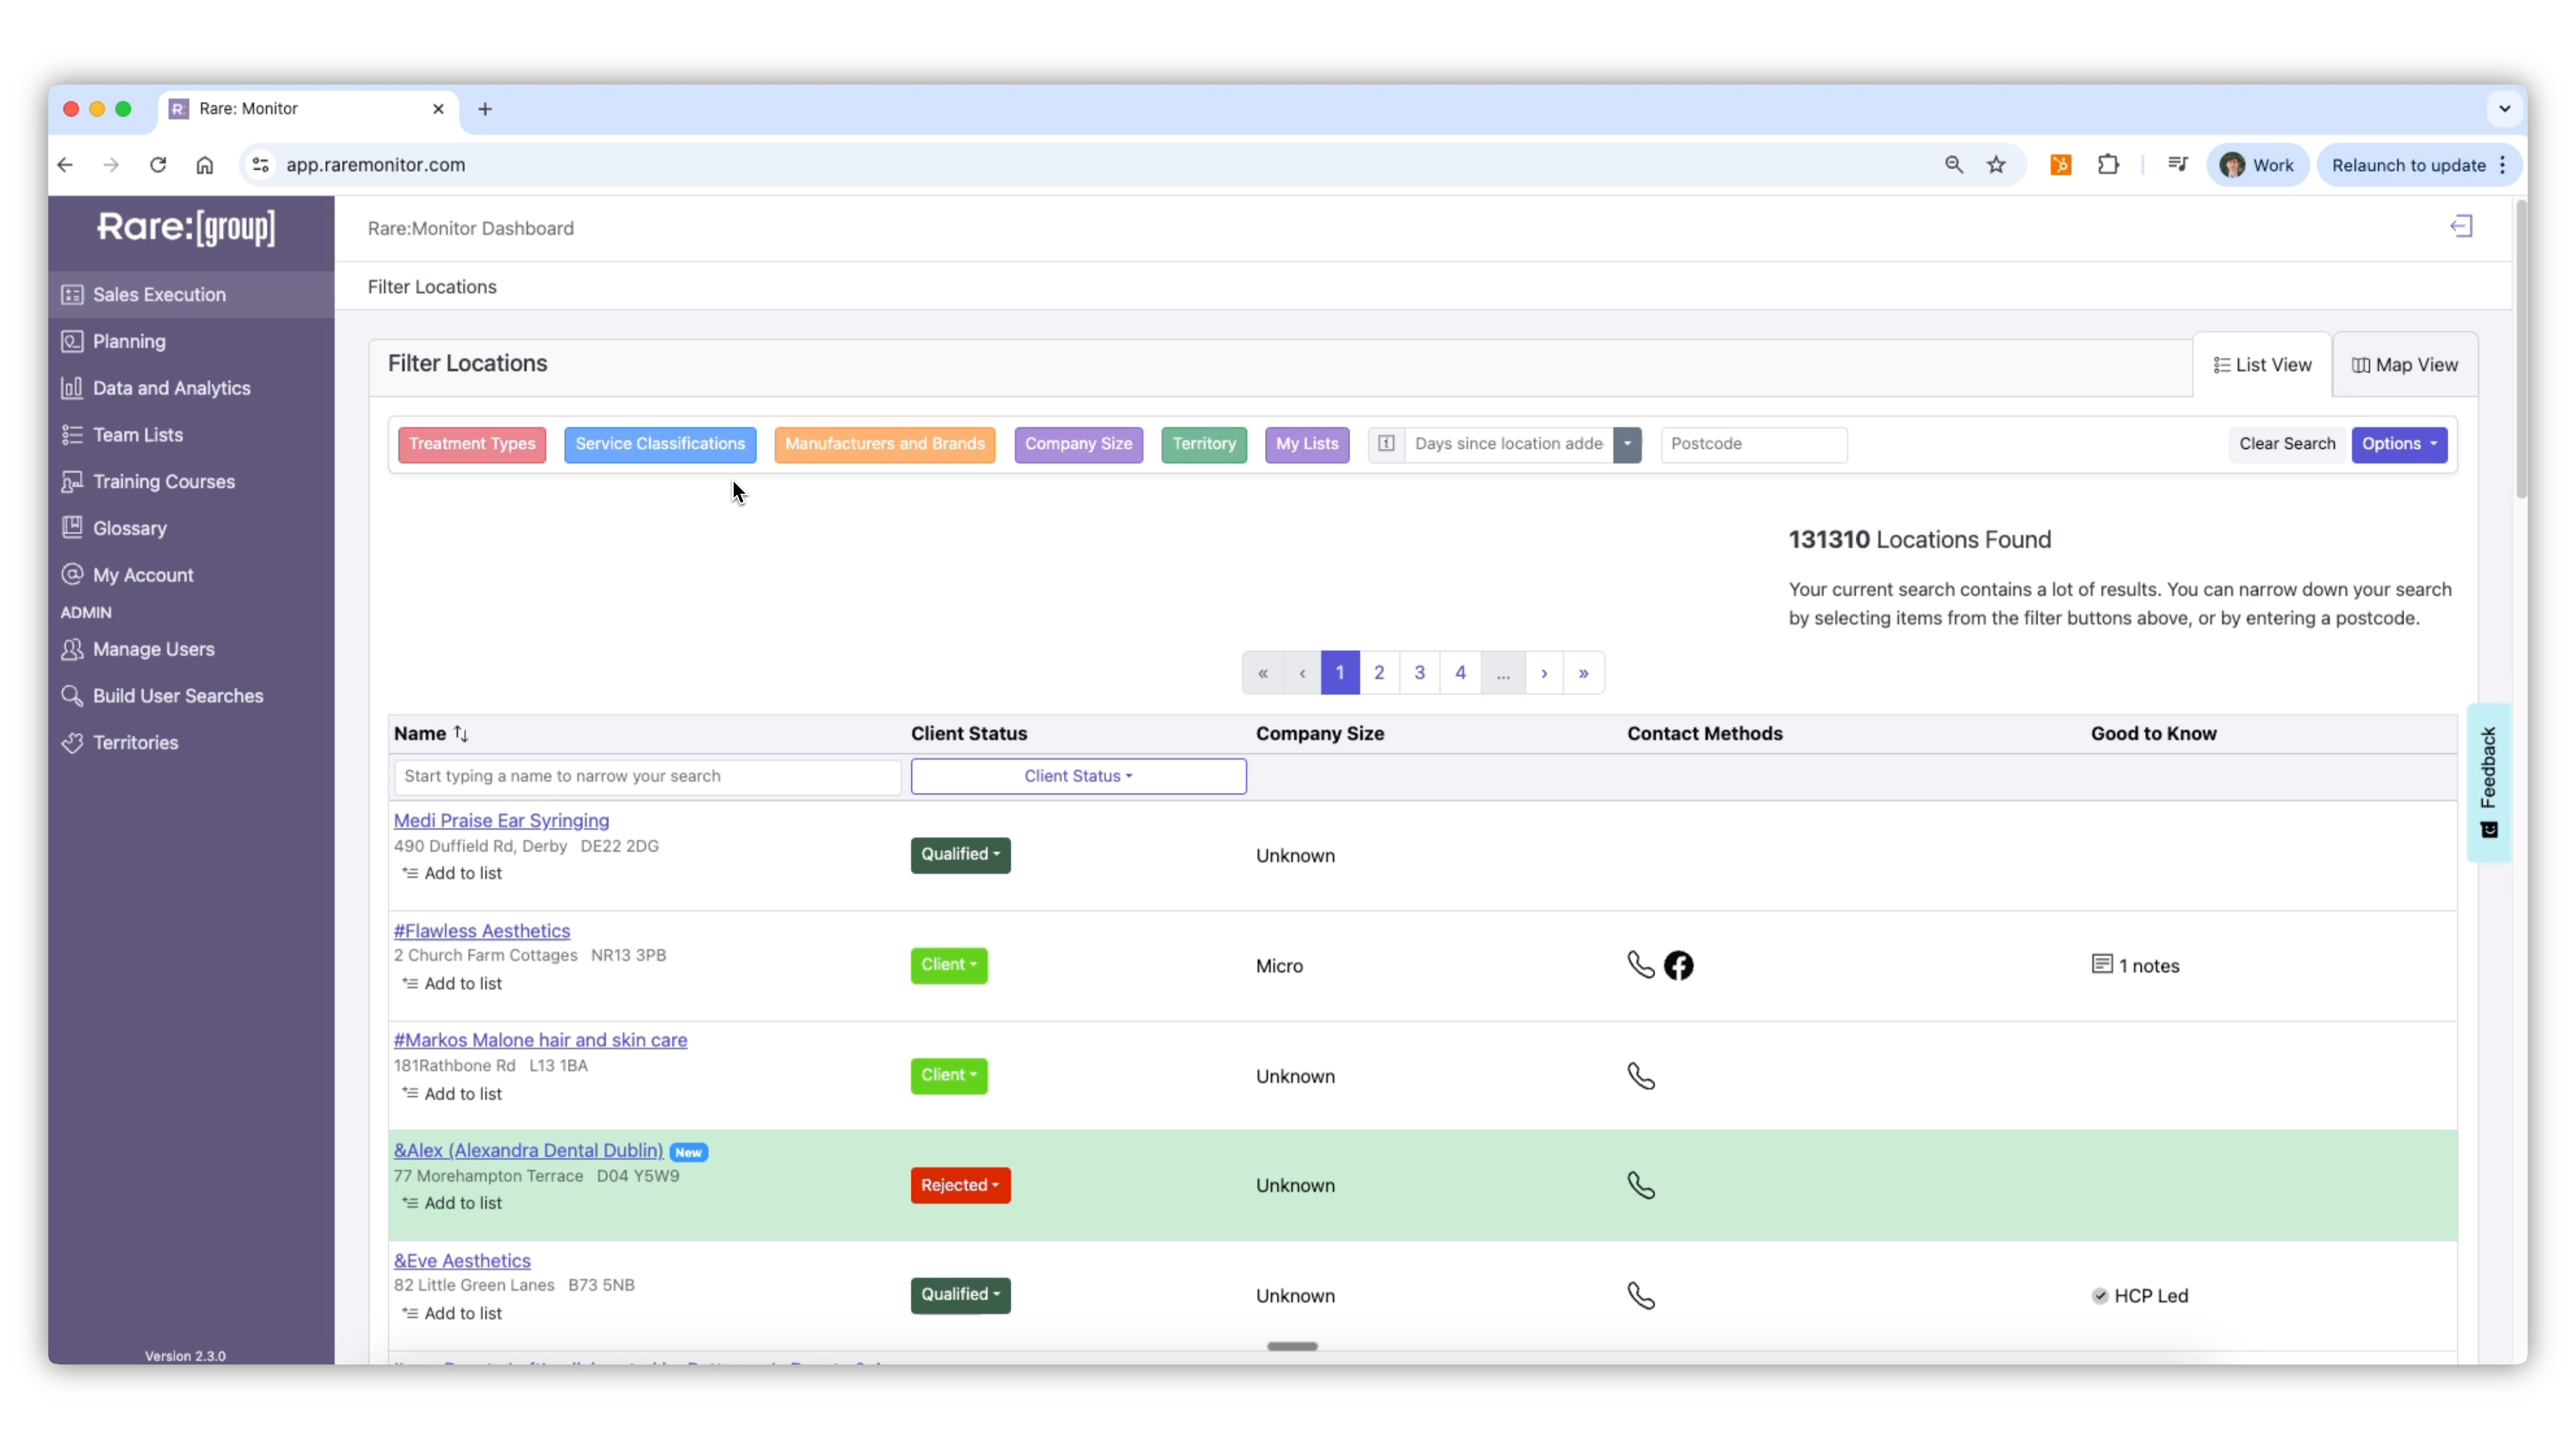
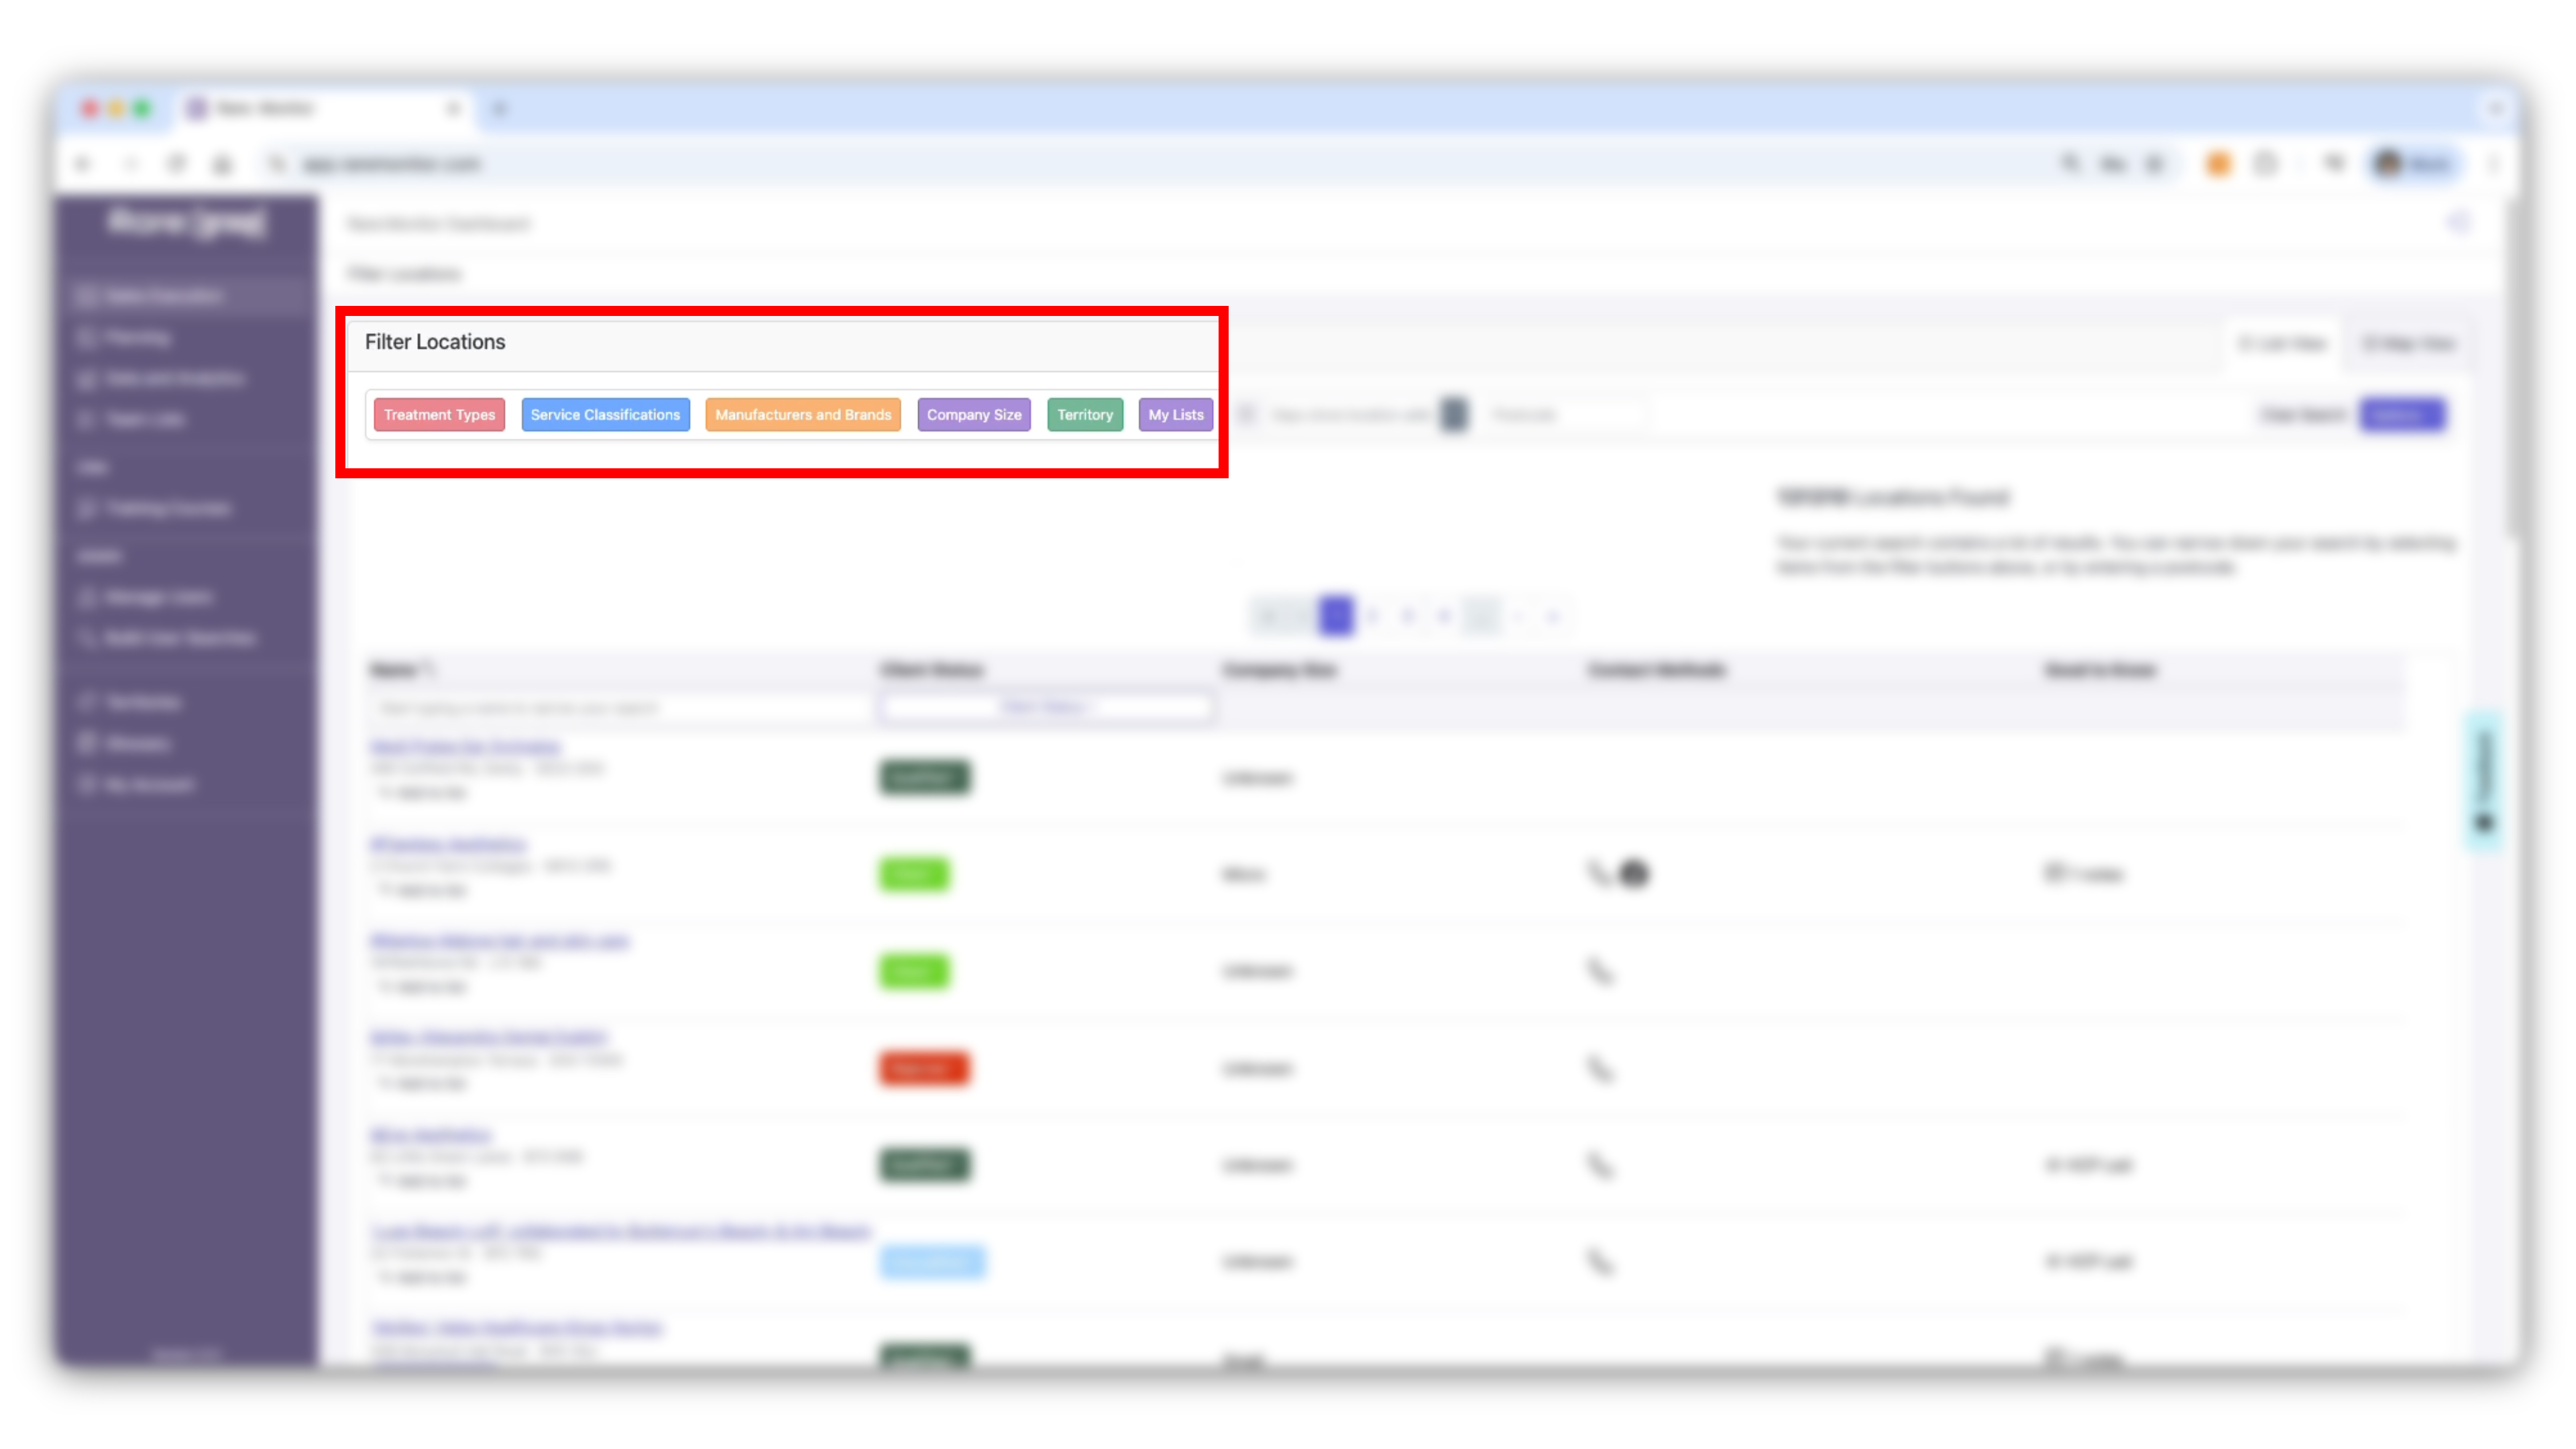
Combine treatments, brands, and geography to turn thousands of clinics into a workable target list.
8 min video
03
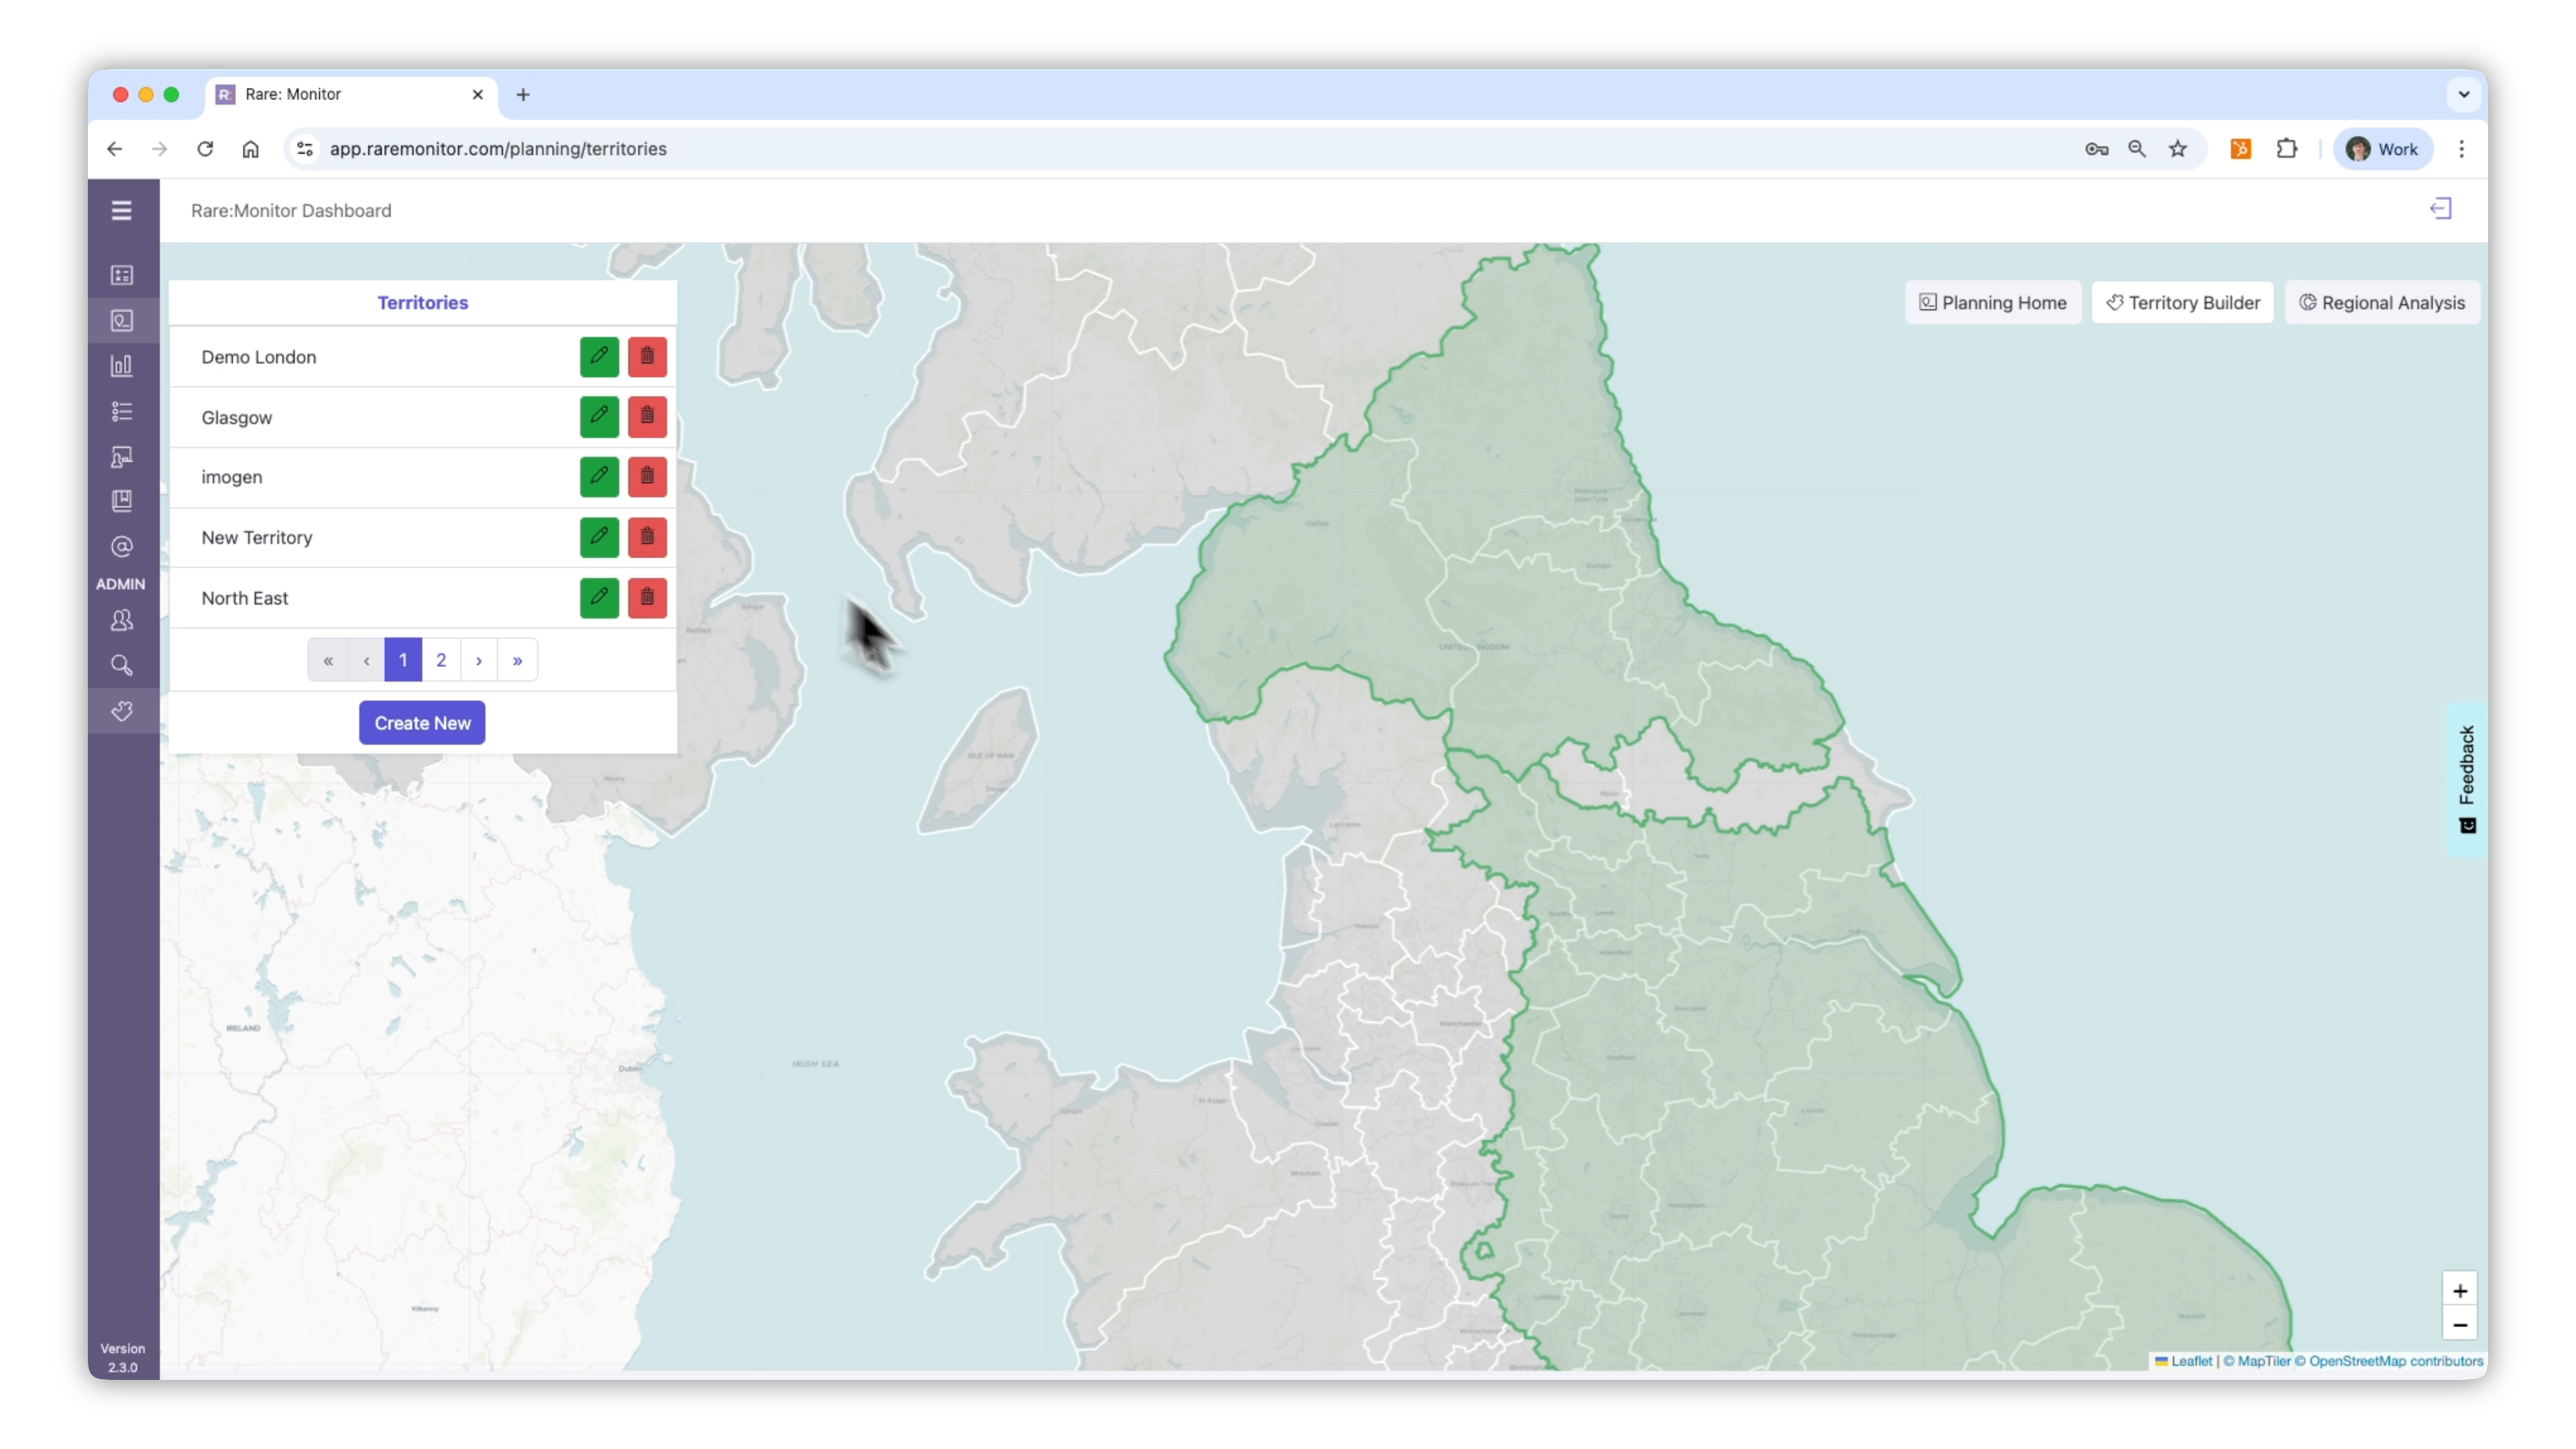
Draw your own sales territories on the map, then search inside them.
5 min video
04
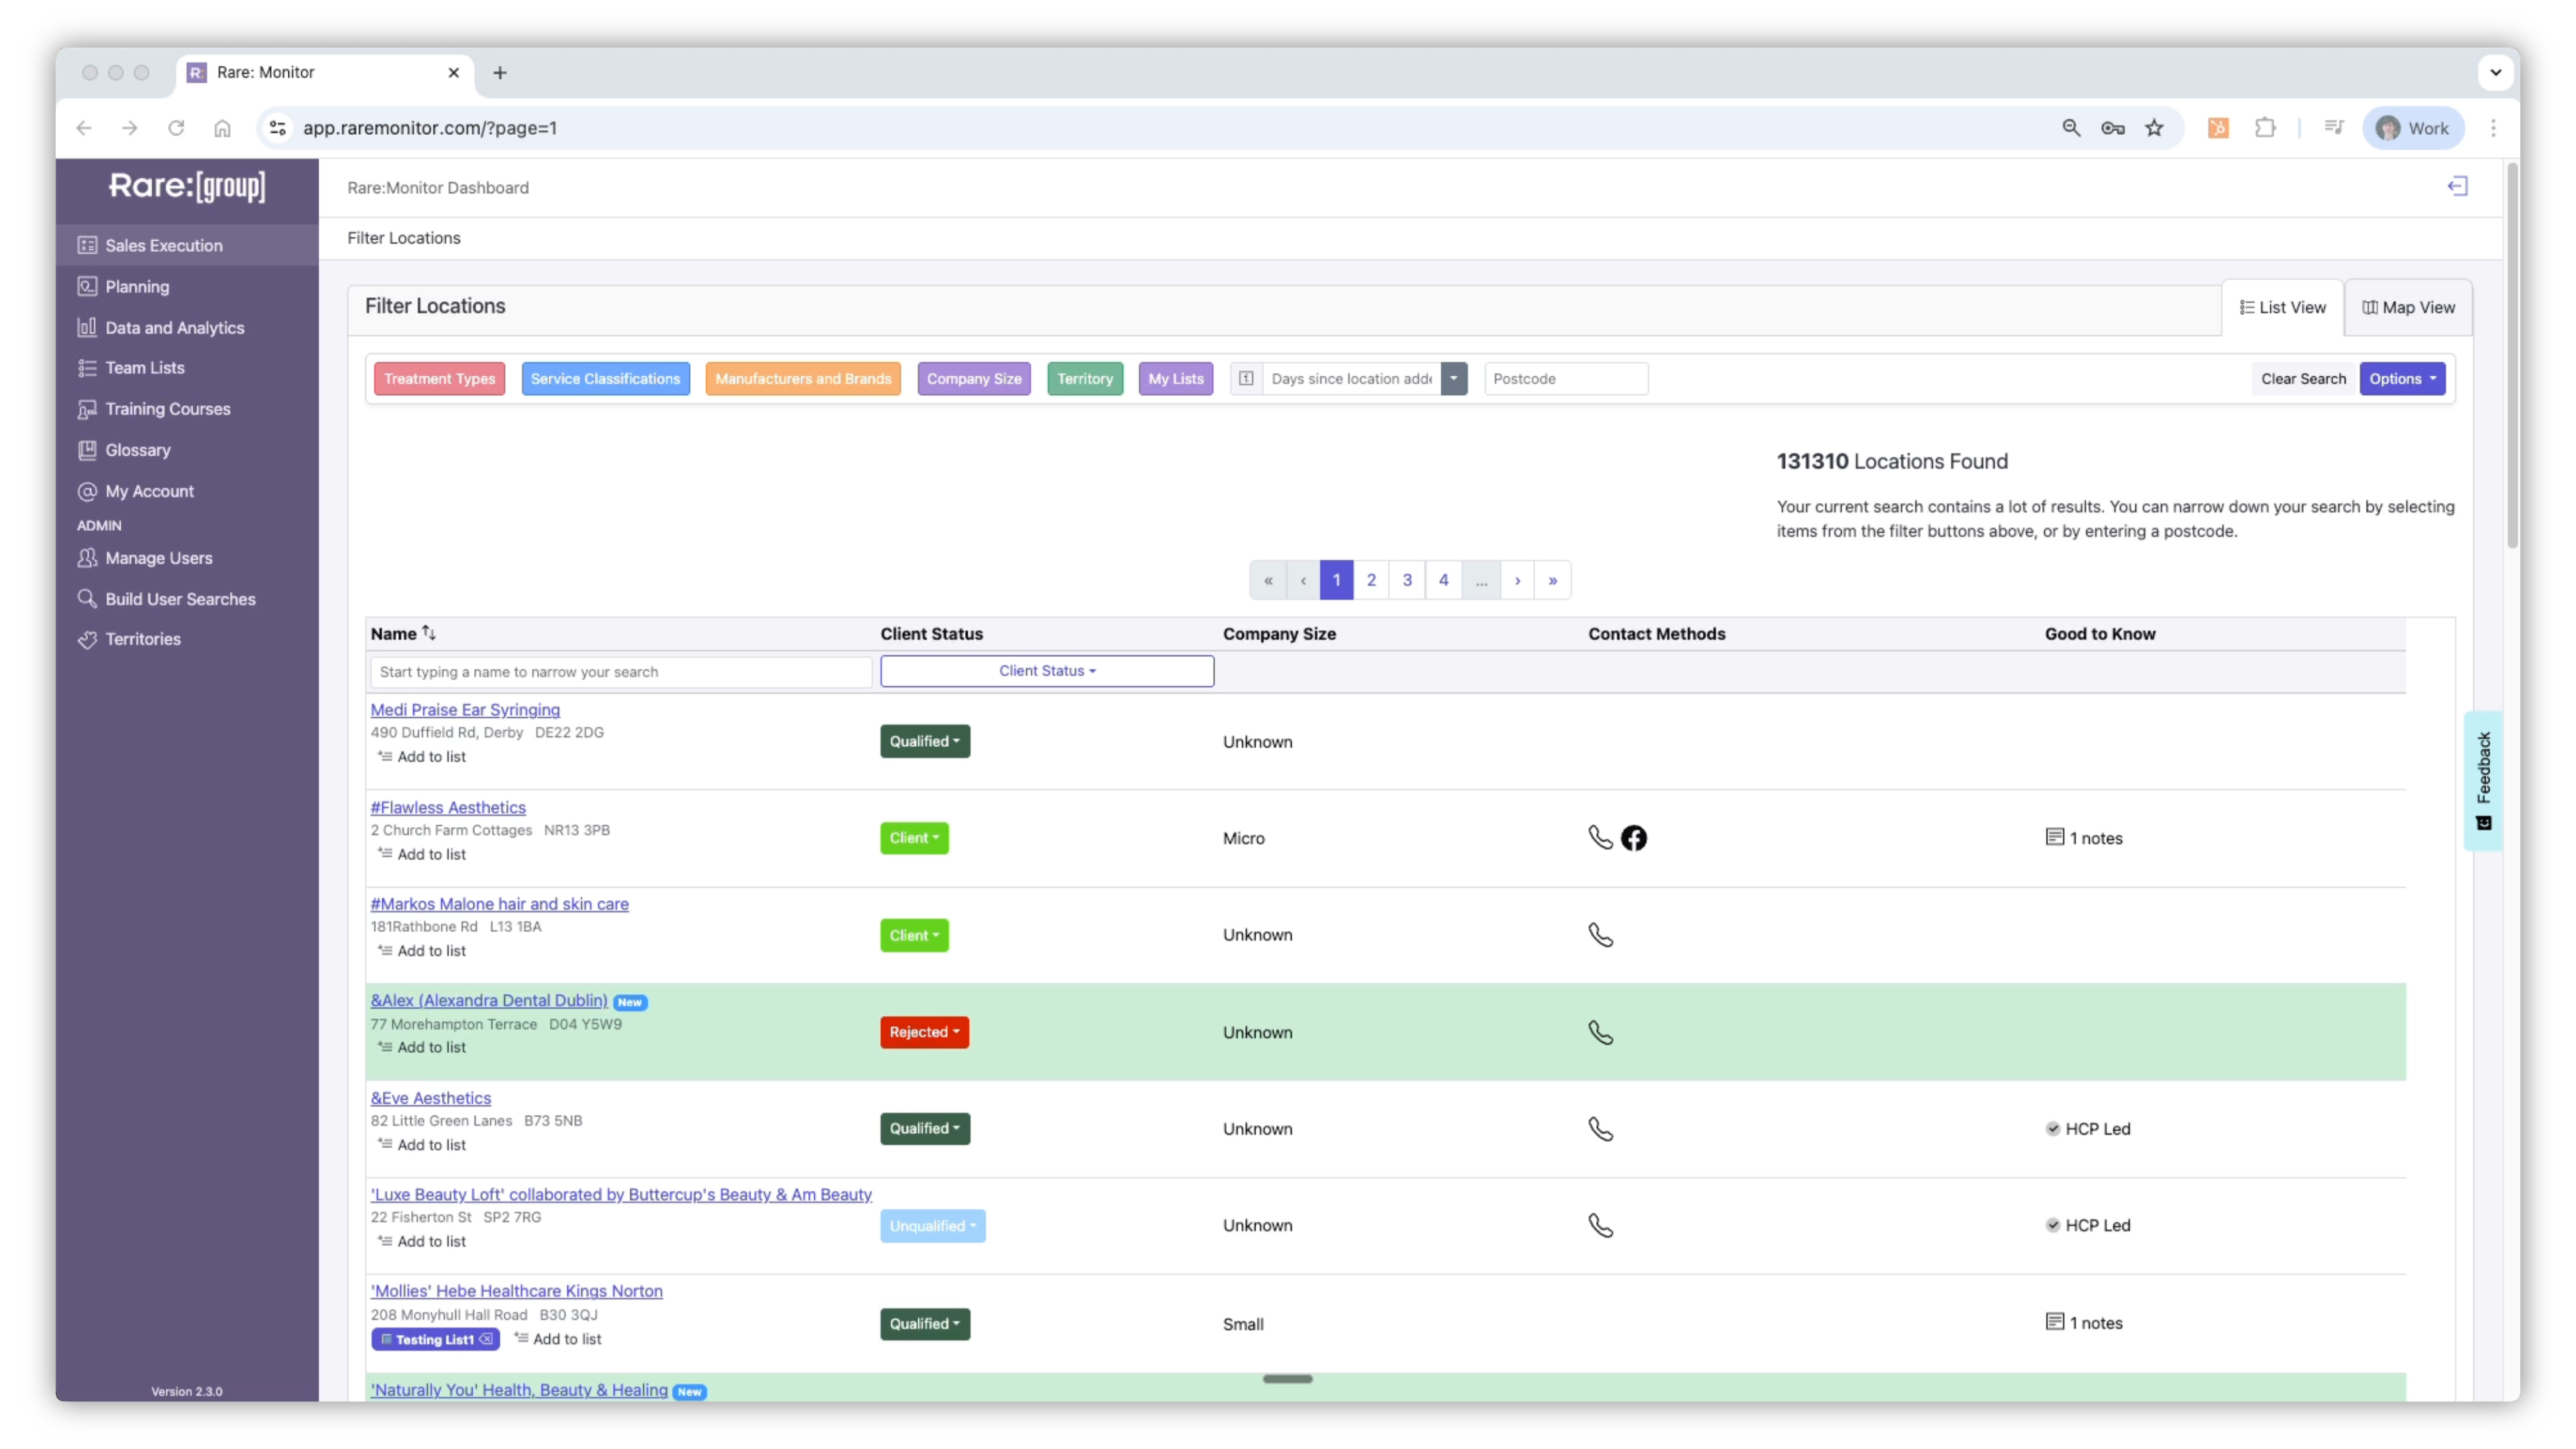
Turn a filtered search into a saved, exportable list, then visualise it on the map.
5 min video
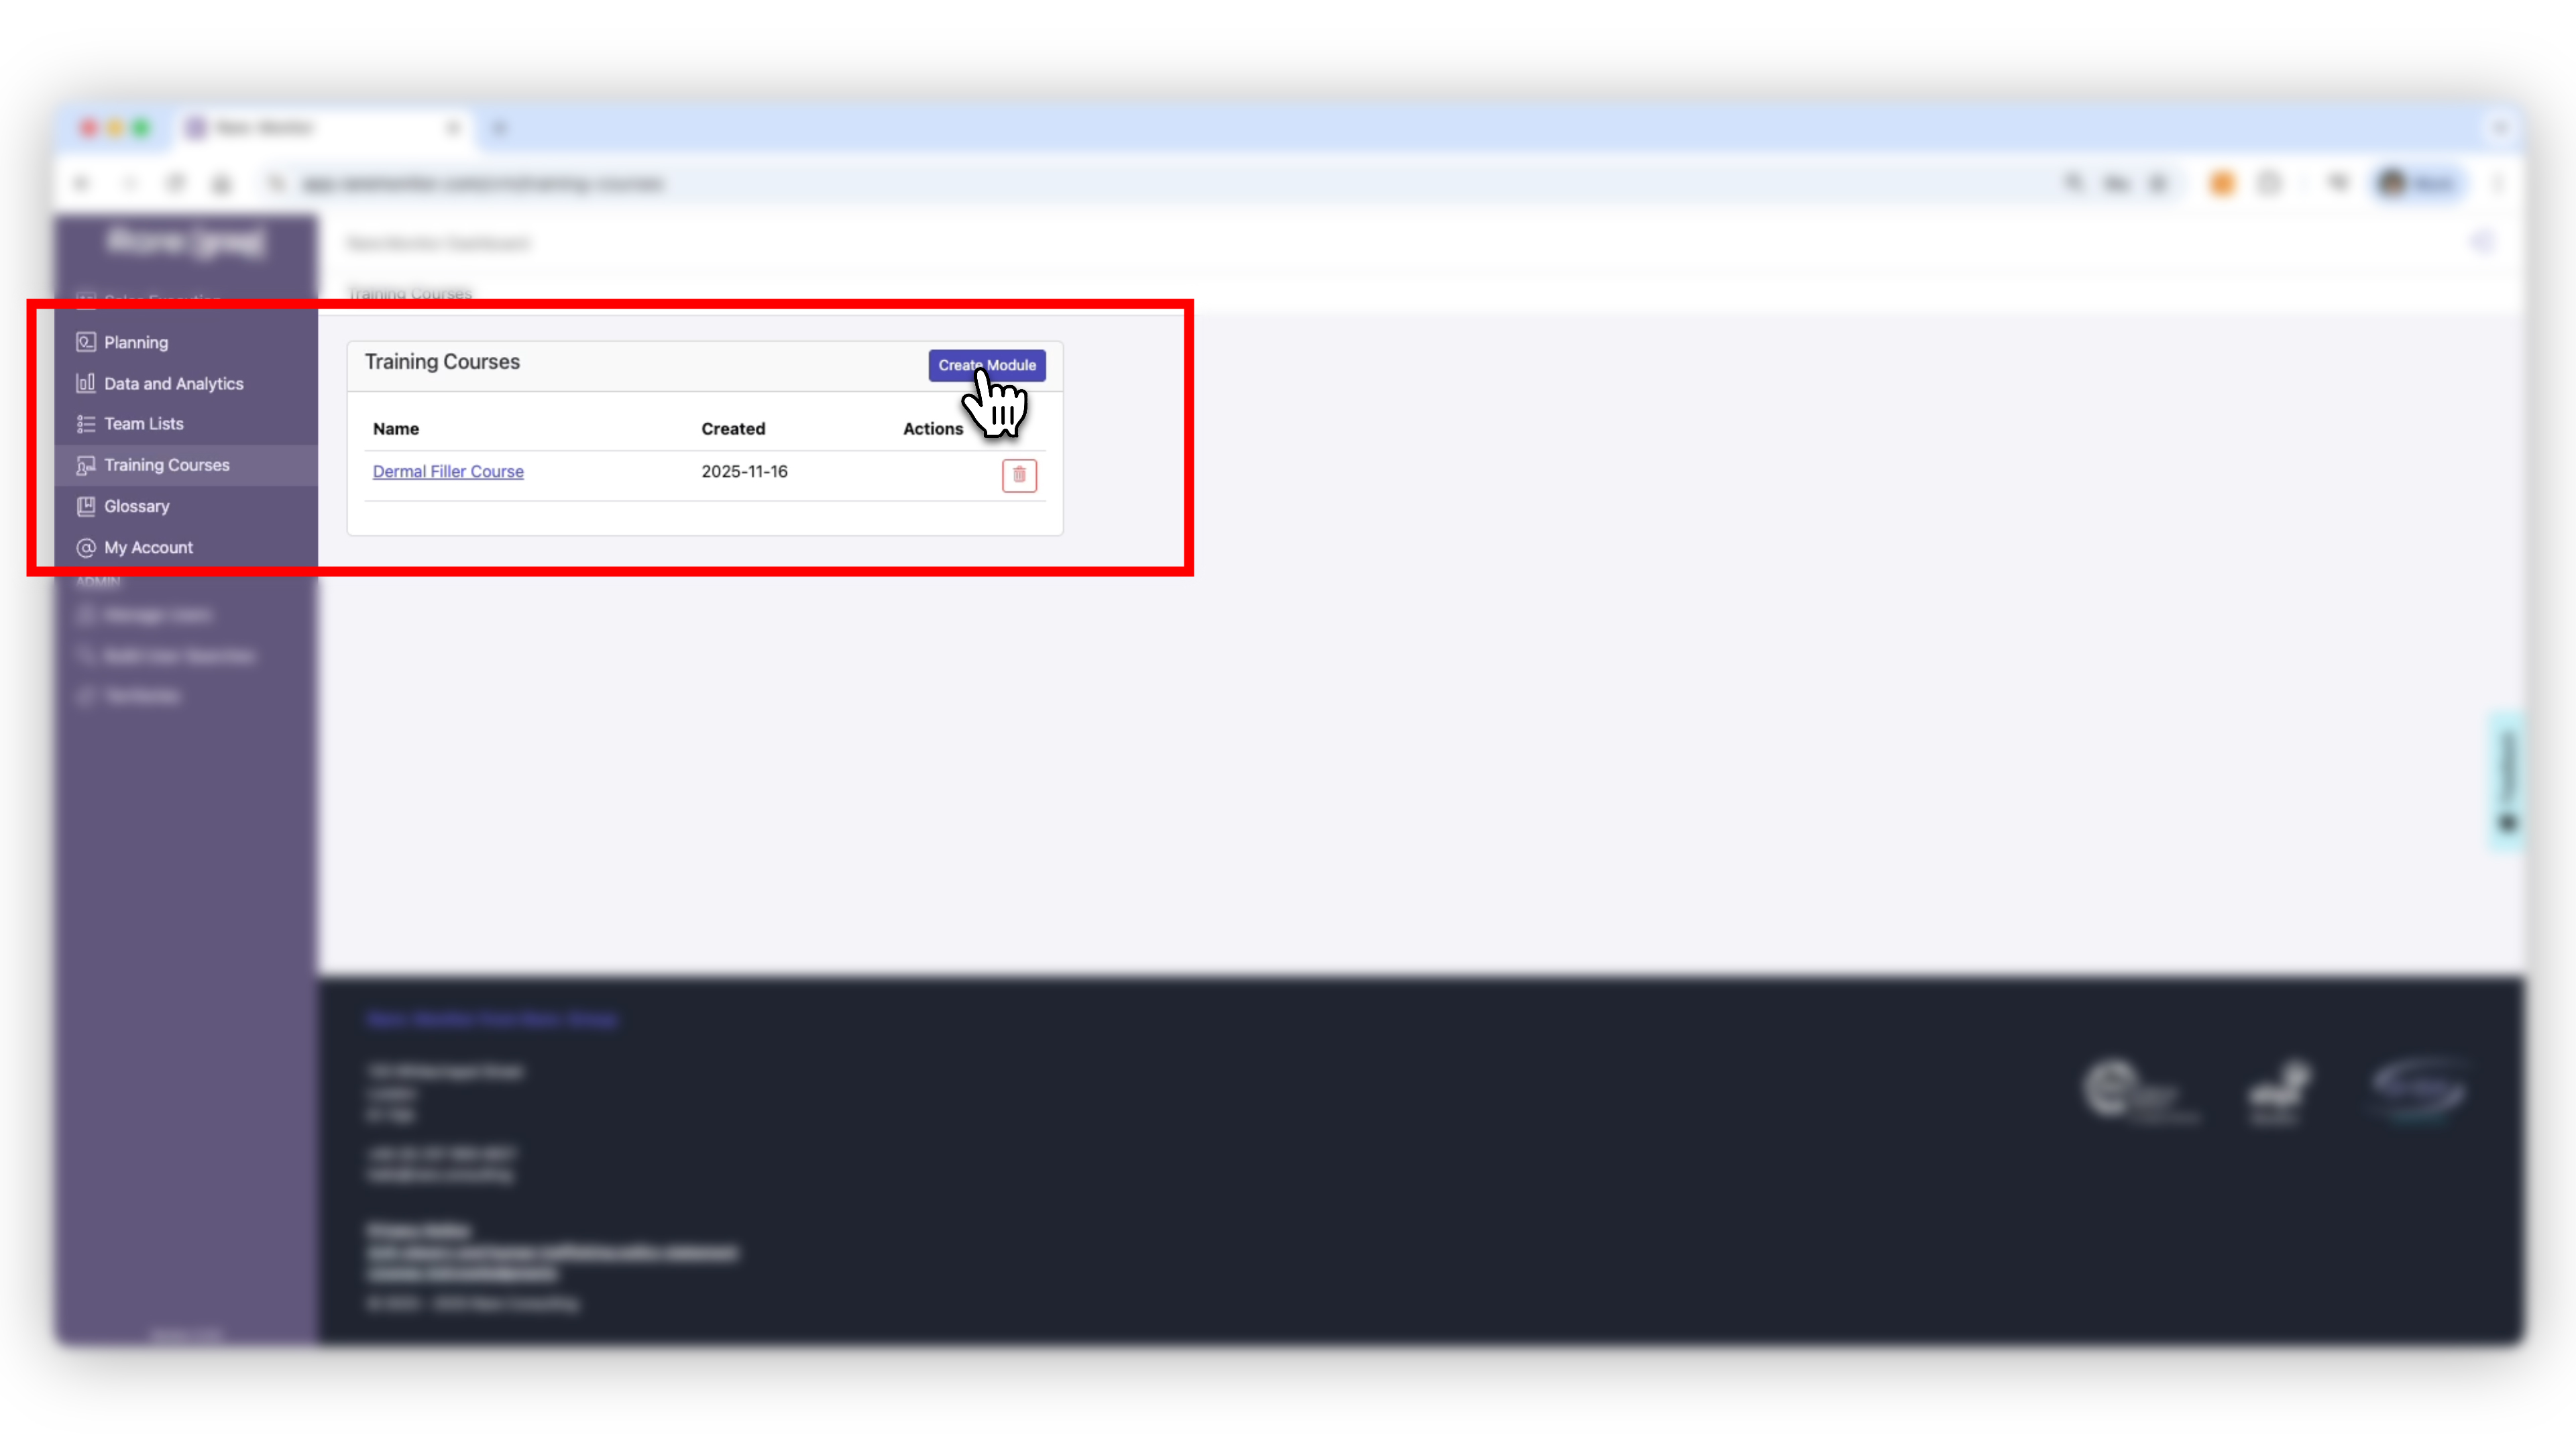
06
Schedule training, log attendees, and link training activity to sales performance.
4 min video
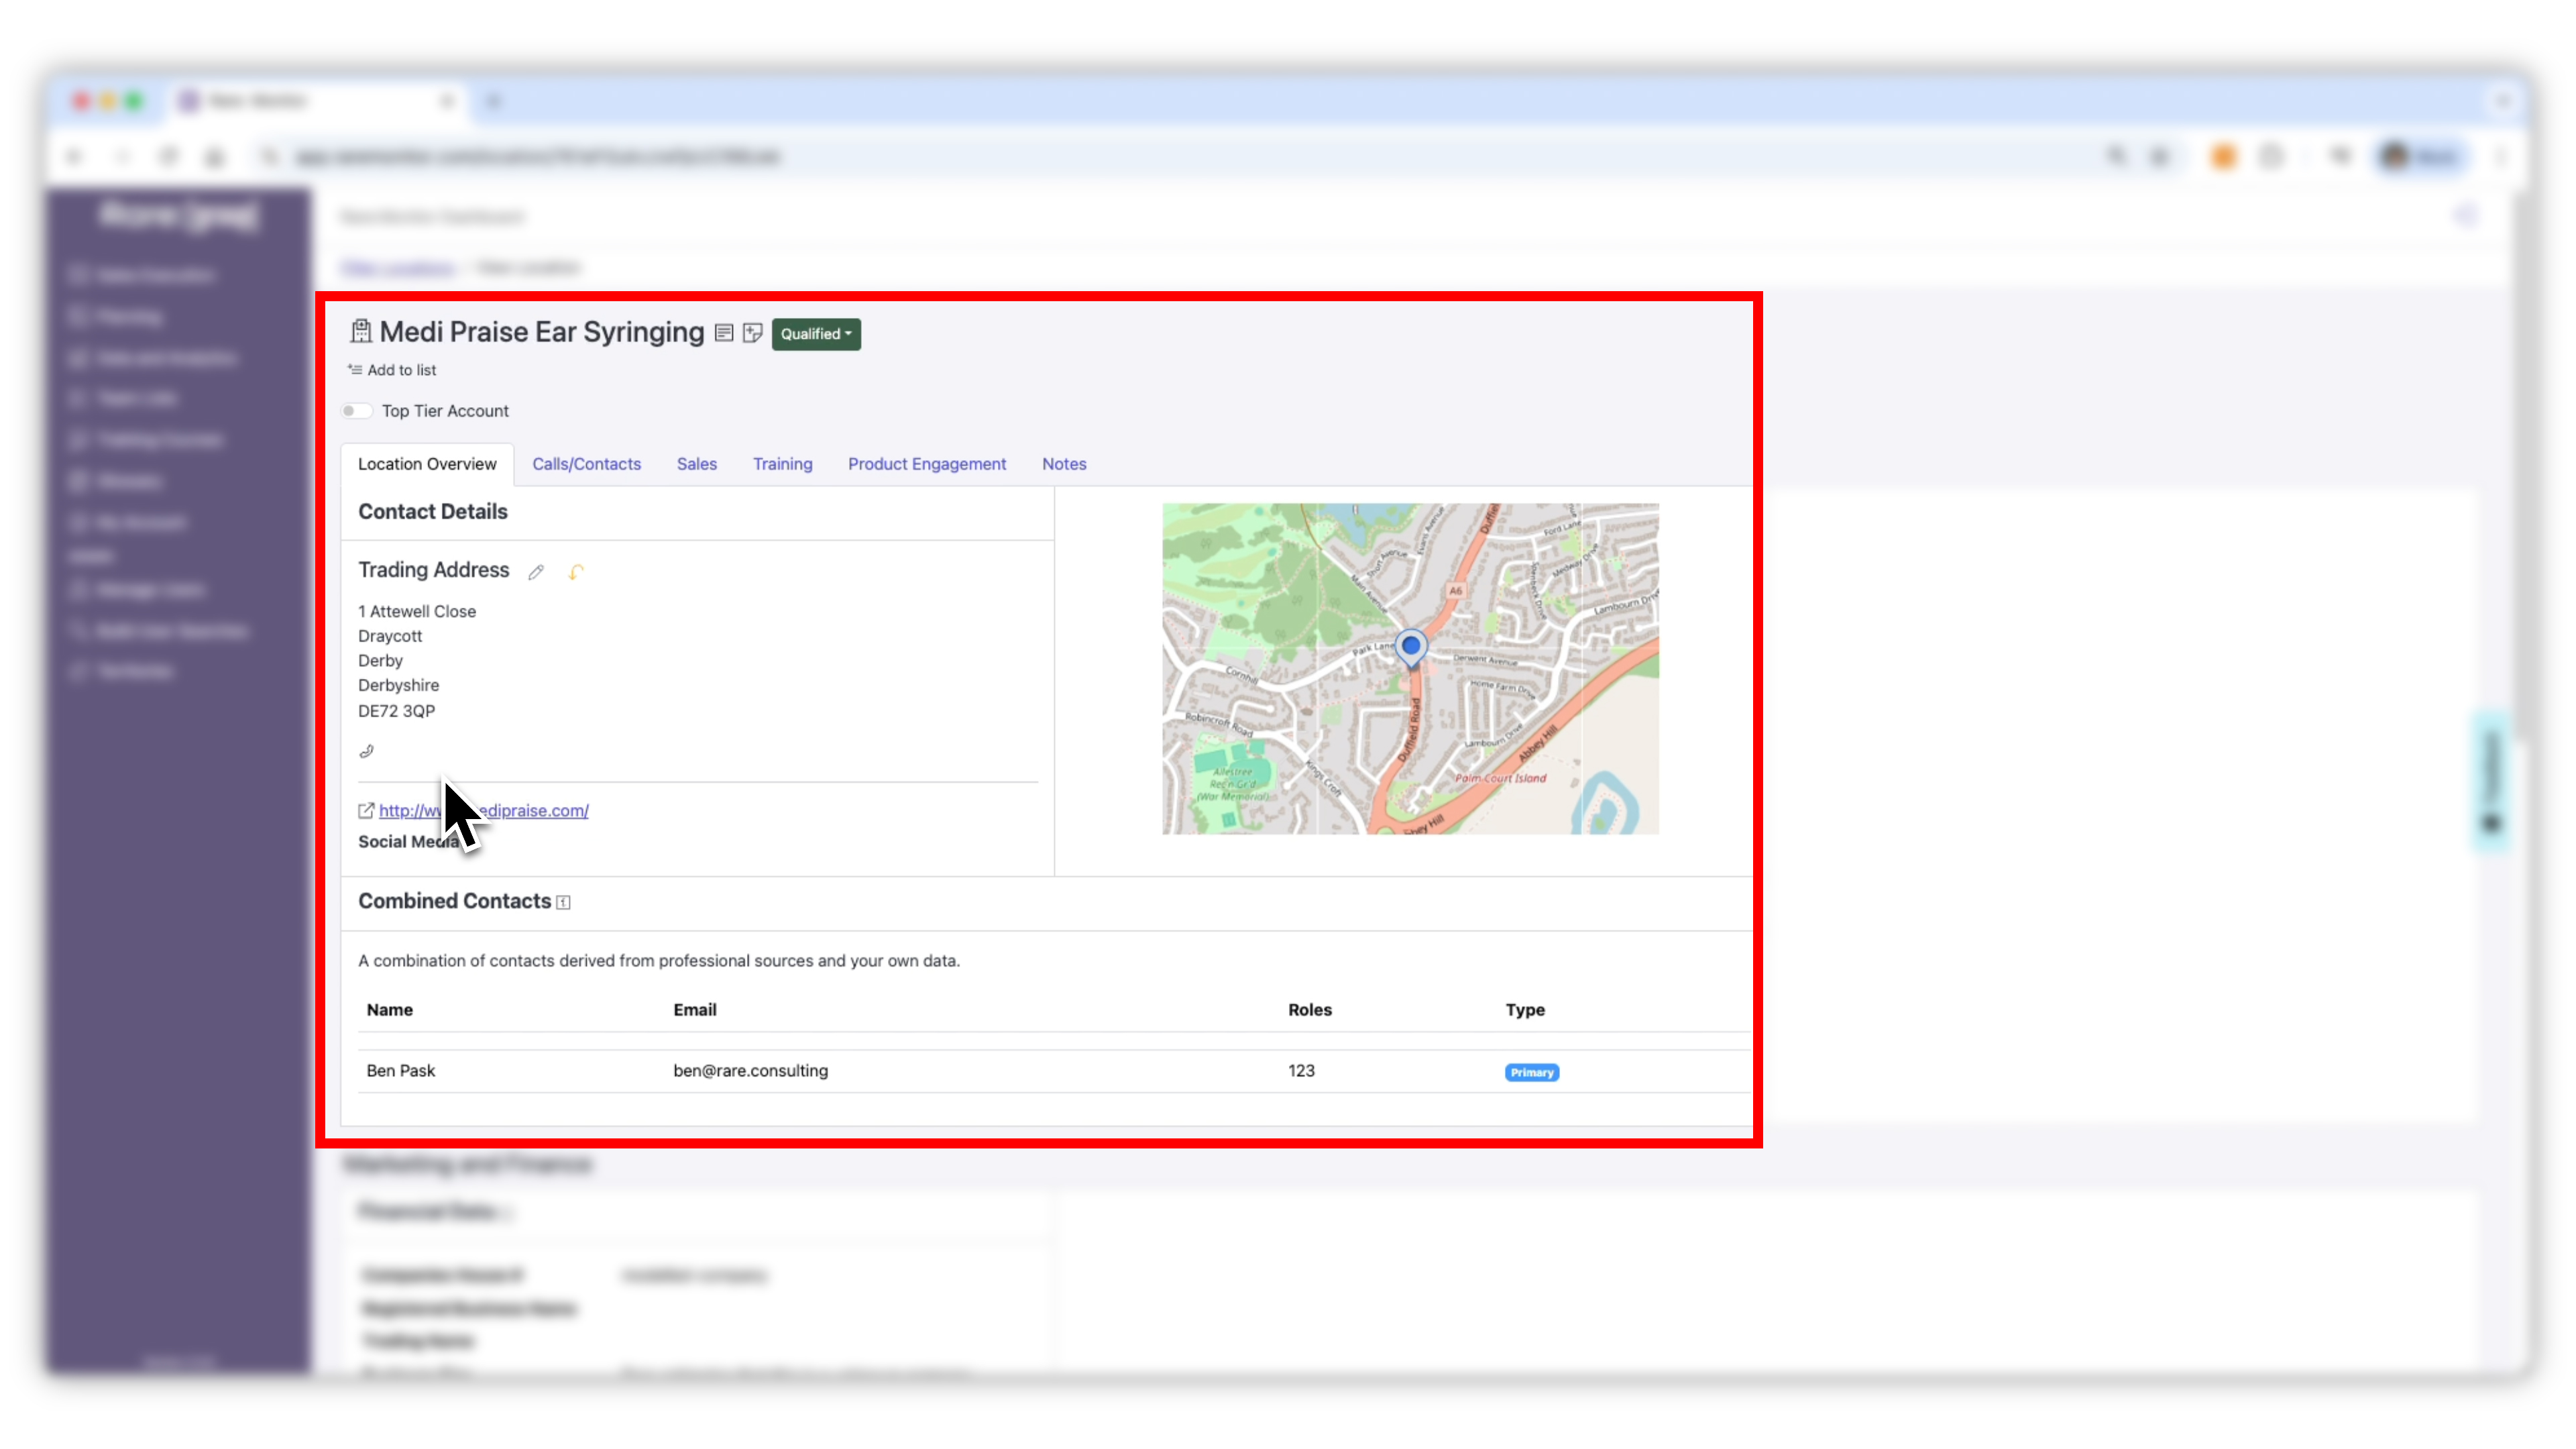
07
Log calls, sales, training, and product engagement against every account.
5 min video