
01
Explore the map behind the numbers
Start here. Filter by prescription category and period to see where NHS dermatology prescribing concentrates, and hover any district to read its rate. The choropleth covers 296 English local authority districts across the 2025/26 financial year, from April 2025 to March 2026, and updates its analysis live as the selected window or British National Formulary (BNF) Chapter 13 category changes.
| Rank | District | Value |
|---|
02
What NHS dermatology prescribing in England adds up to
Four figures set the scale. England dispensed 25.6 million dermatology items in 2025/26 at £287 million of prescribing cost, across 296 local authority districts and 3,552 district-months with no missing values. The national rate averaged 33.5 items per 1,000 registered patients per month.
Dermatology items dispensed
25.6m
England, April 2025 to March 2026, British National Formulary Chapter 13 (skin).
Prescribing cost
£287m
Total cost recorded in the aggregated extract. NHS primary care only.
National rate
33.5
Items per 1,000 registered patients per month, averaged across 12 months.
Districts covered
296
English local authority districts, 3,552 district-months with no gaps.
03
How much does NHS dermatology prescribing vary across England?
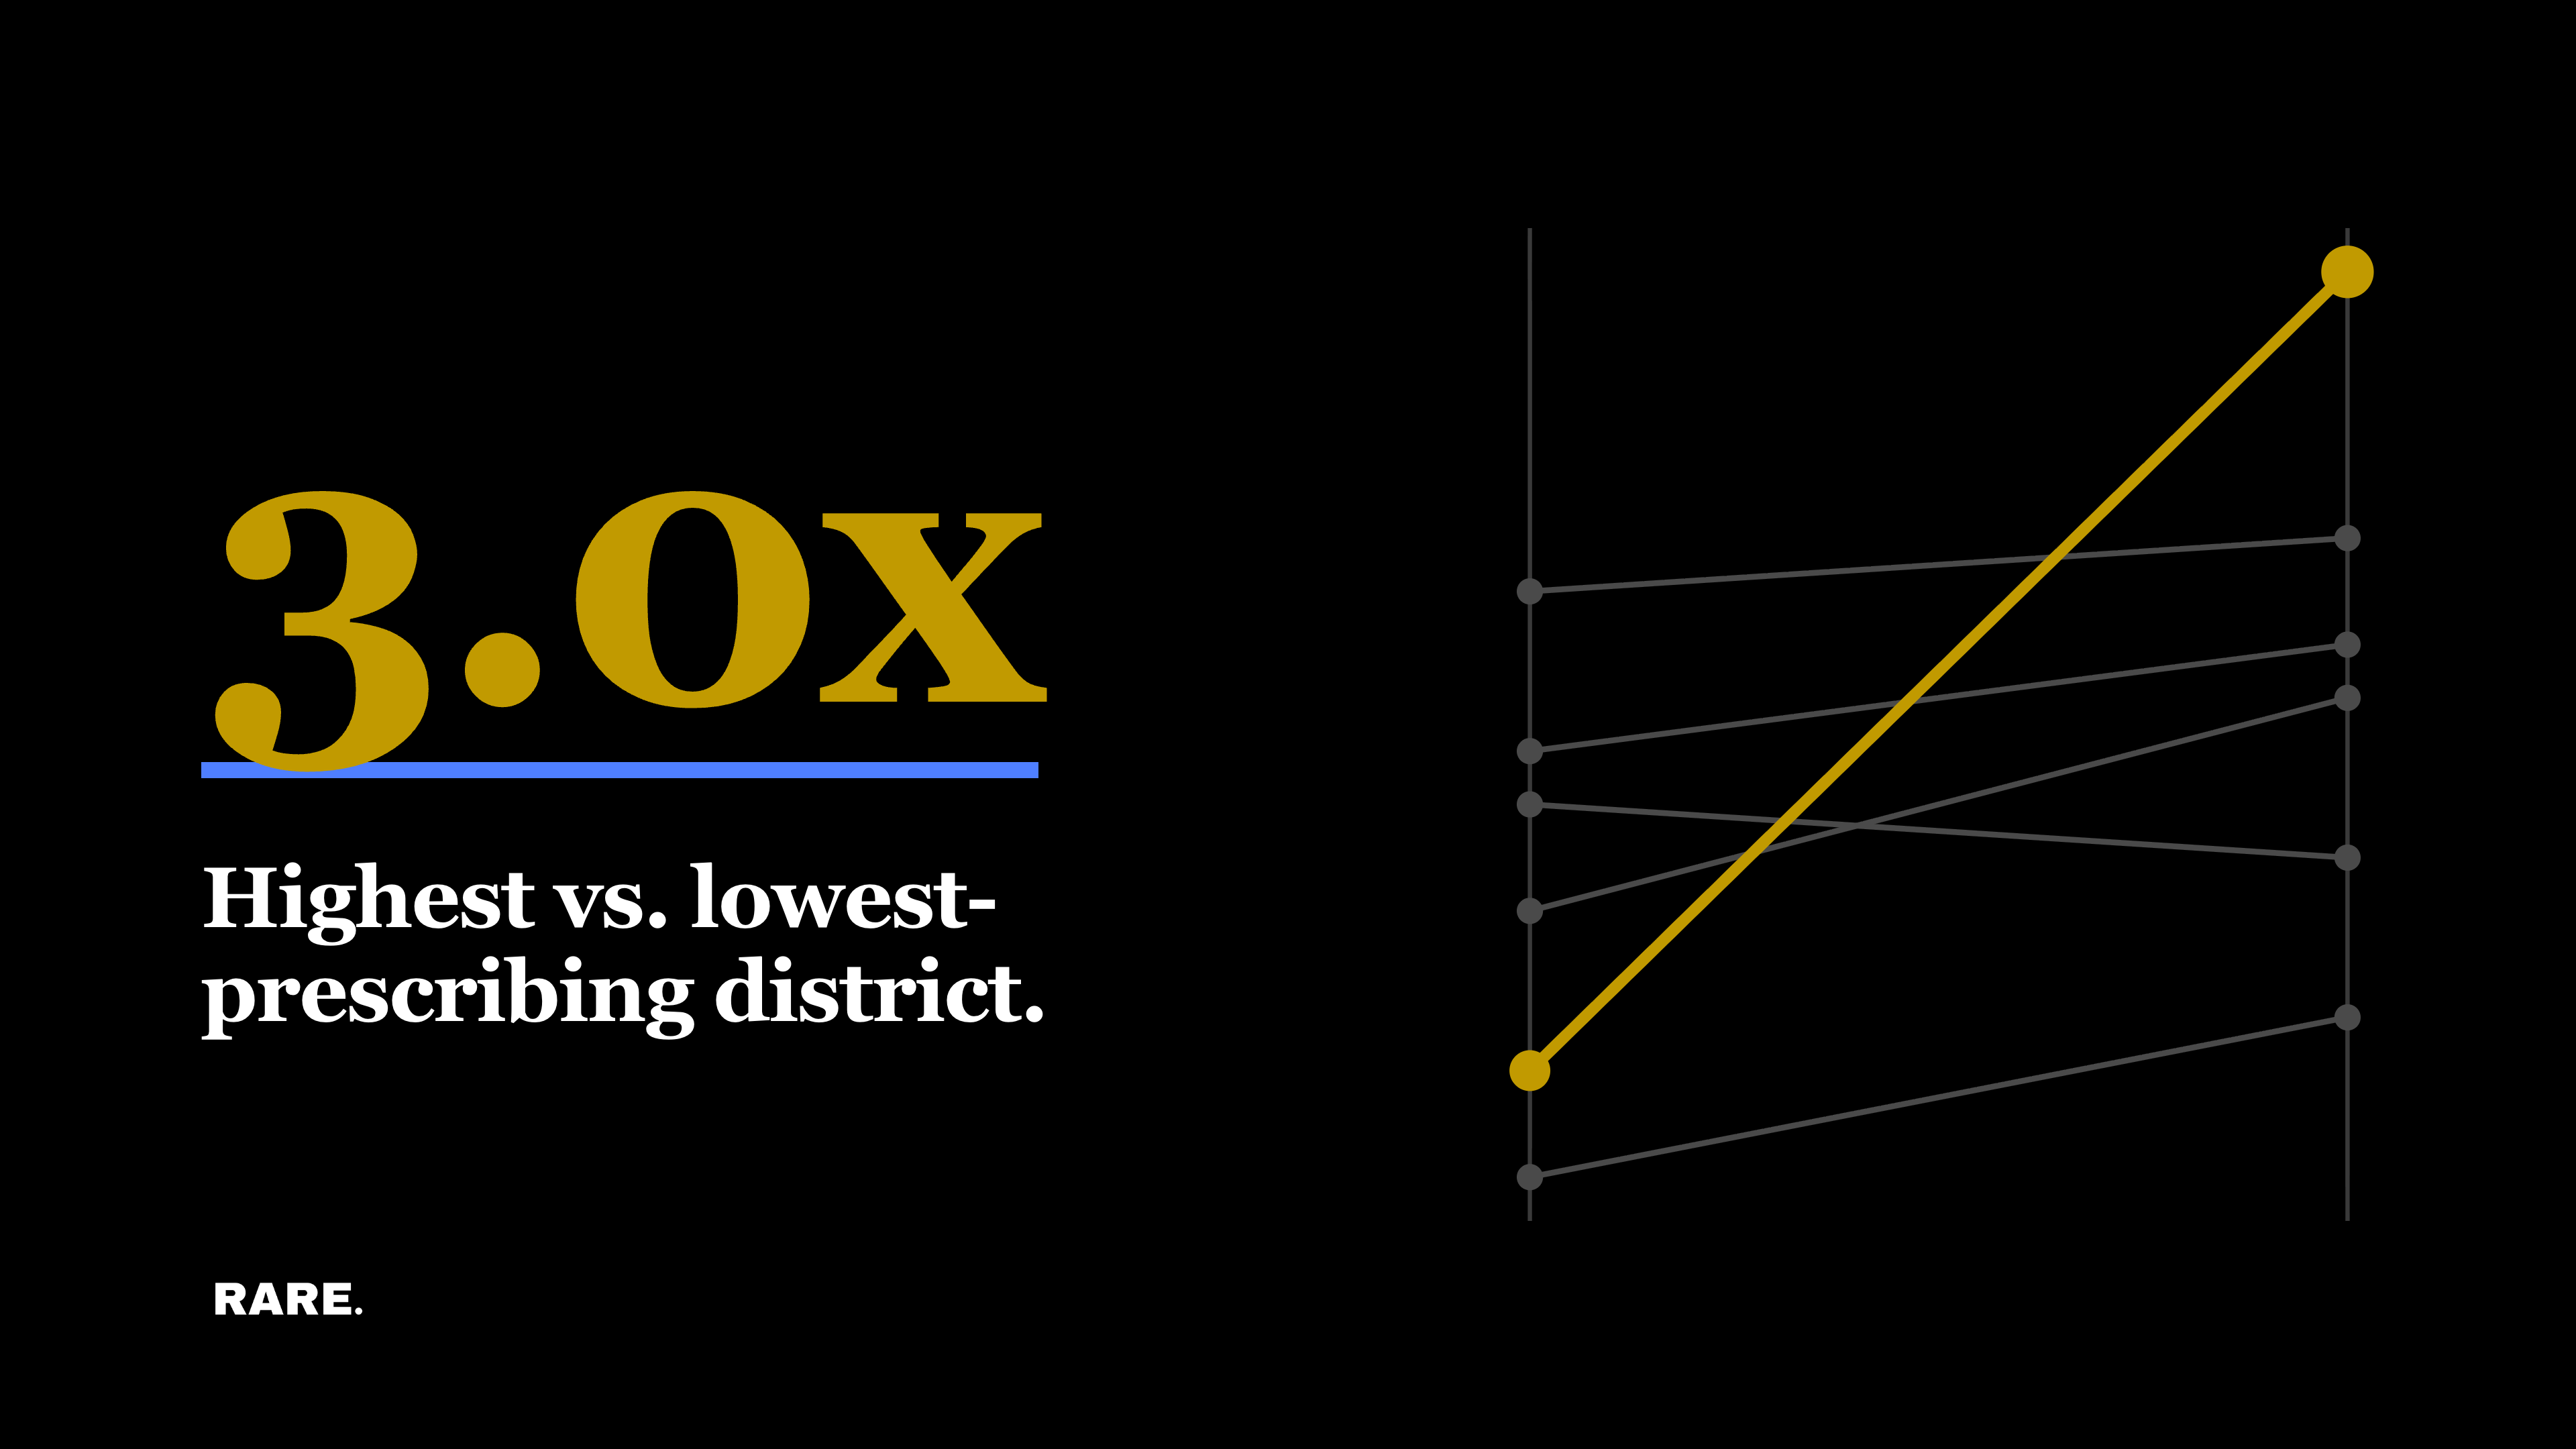
Across the 2025/26 financial year, 296 English local authority districts averaged 33.5 dermatology items per 1,000 registered patients each month. The spread around that average is what matters: the highest-prescribing district dispensed three times as many items as the lowest, and the gap held in every month measured.
Knowsley dispensed 56.4 dermatology items per 1,000 registered patients per month across 2025/26. Gravesham dispensed 18.7. Between them sit 294 other English districts, on a combined 25.6 million items and £287 million of prescribing cost. Analysis by Rare.Monitor of the NHS Business Services Authority English Prescribing Dataset (EPD).
The two ends of the table are the extremes, and most districts sit far closer together: the middle 80% of England spans 25.2 to 40.5 items per 1,000 registered patients per month, a spread of 1.6 times. The threefold figure is the distance from the top of the ranking to the bottom, not the distance between two districts picked at random.
These are rates, not raw counts. Each district is measured against the patients registered there, so a large district does not look busy simply for being large. What the data cannot tell us is why the gap exists: it counts items dispensed, not people diagnosed, and it is not adjusted for age or deprivation.
04
The highest and lowest districts are 3.0 times apart
Knowsley heads the table at 56.4 items per 1,000 registered patients per month and Gravesham sits at the foot on 18.7. Five of the seven highest districts are in Merseyside; four of the six lowest are in north Kent, with two inner London boroughs alongside them.
Show data table
| Category | Items per 1,000 registered patients per month |
|---|---|
| Knowsley | 56.4 |
| Liverpool | 53.6 |
| Sefton | 51.1 |
| Birmingham | 50.5 |
| Wirral | 50.2 |
| St. Helens | 46.7 |
| Bradford | 45.9 |
| Medway | 22.1 |
| Hammersmith and Fulham | 21.8 |
| City of London | 21.6 |
| Kensington and Chelsea | 20.3 |
| Dartford | 19.7 |
| Gravesham | 18.7 |
The seven highest-prescribing and six lowest-prescribing English local authority districts, ranked on the mean monthly rate across April 2025 to March 2026. The 283 districts between them are not shown. Signal red marks the two extremes. Source: NHS Business Services Authority English Prescribing Dataset, financial year 2025/26. Analysis by Rare.Monitor.
05
Why the top of the table clusters in the North West
Five neighbouring Merseyside districts all prescribe above 46 items per 1,000 registered patients per month, roughly 40% above the English average. A cluster that tight points to a shared regional pattern rather than a handful of unusual practices, and the prescribing record alone cannot say what drives it.
The seven highest districts are all metropolitan: Knowsley at 56.4, Liverpool at 53.6, Sefton at 51.1, Birmingham at 50.5, Wirral at 50.2, St. Helens at 46.7 and Bradford at 45.9. Five of those are in Merseyside, and every one of the five sits above 46 items per 1,000 registered patients per month. Thirteen of the twenty highest-prescribing districts in England are in the North West.
The tightness of the cluster is the signal. Five neighbouring districts sitting roughly 40% above the English average points to a shared regional pattern, not to a small number of high-prescribing practices. What it does not do is separate a higher burden of skin disease from higher rates of presentation and treatment in primary care. Both readings fit these figures, and the prescribing record holds nothing that would tell them apart. Our analysis of anxiety prevalence across English local authorities found the same caution applies wherever an administrative count stands in for need.
06
Month-to-month movement is a fraction of the gap between districts
Over the year the national rate varied by just 4.3 items per 1,000 registered patients, from a high of 35.6 in July 2025 to a low of 31.3 in February 2026, a band of about 14%. That entire national swing is smaller than the gap between many pairs of neighbouring districts.
Show data table
| Category | England, items per 1,000 registered patients per month |
|---|---|
| Apr 2025 | 33.4 |
| May 2025 | 34.8 |
| Jun 2025 | 34 |
| Jul 2025 | 35.6 |
| Aug 2025 | 31.6 |
| Sep 2025 | 33.4 |
| Oct 2025 | 34.2 |
| Nov 2025 | 31.7 |
| Dec 2025 | 32.7 |
| Jan 2026 | 34.3 |
| Feb 2026 | 31.3 |
| Mar 2026 | 34.8 |
The English monthly rate across 2025/26, drawn on the same vertical scale as the district chart above so the two are directly comparable. The annual high of 35.6 in July 2025 and the annual low of 31.3 in February 2026 are marked in signal red. There is no clean seasonal curve: August 2025 sat at 31.6, close to the annual low, and March 2026 reached 34.8. Source: NHS Business Services Authority English Prescribing Dataset, financial year 2025/26. Analysis by Rare.Monitor.
07
What low prescribing does not tell you
Six districts prescribe under 23 items per 1,000 registered patients per month. The prescribing record cannot say whether that reflects healthier skin, care obtained outside NHS primary care, or people who are not being treated at all. That distinction matters more for commissioning than anything at the top of the table.
The six lowest districts are Gravesham at 18.7 items per 1,000 registered patients per month, Dartford at 19.7, Kensington and Chelsea at 20.3, City of London at 21.6, Hammersmith and Fulham at 21.8 and Medway at 22.1. Four sit in north Kent and two are inner London boroughs, so the bottom of the table is not one geography.
Low NHS prescribing is not evidence of low need. The English Prescribing Dataset records items dispensed against NHS prescriptions in primary care and nothing else. It does not capture private prescriptions, over-the-counter purchase, hospital-issued dermatology treatment, or need that never reaches a GP. A district at the foot of this table could have less skin disease, better access to care outside the NHS, or unmet need the prescribing record cannot see. This analysis cannot distinguish between those explanations, and a service planner should not assume the first without local evidence. Community pharmacy access patterns show a similar geographic spread, where place explains far more than time of year.
08
What this settles, and what it leaves open
Geography is the finding. A gap of 3.0 times between the highest and lowest districts, holding in all 12 months of the year, is a structural feature of English dermatology care, and the 14% national swing across the calendar is small beside it. The open question sits at the bottom of the table, not the top.
The prescribing record settles the size and the shape of the gap. Knowsley dispenses 56.4 items per 1,000 registered patients per month; Gravesham dispenses 18.7. Five of the seven highest-prescribing districts sit in Merseyside, and all seven are above 46. That ordering holds whether the window is 12 months, six months or three, so it is not an artefact of the period chosen.
What it leaves open is why the bottom of the table is so low. A district with few dermatology prescriptions is either a district with less skin disease or a district where skin disease is not reaching a prescriber. Prescribing data cannot separate those two, and the difference matters enormously for anyone planning services. Gravesham, Dartford and Medway sit together at the foot of the ranking, which is a pattern worth a referral-level look rather than a prescribing-level one.
09
Questions this dataset can and cannot answer
Eight answers below cover the size of the gap, where prescribing is highest and lowest, whether the pattern is seasonal, and what the £287 million covers. Each one is drawn from the same 2025/26 extract of 296 districts, and each states what the prescribing record cannot show.
How much does NHS dermatology prescribing vary across England?
It varies threefold between the highest and lowest districts. Across the 2025/26 financial year, Knowsley dispensed 56.4 dermatology items per 1,000 registered patients per month and Gravesham dispensed 18.7, a ratio of 3.0 to 1. The gap held in every one of the 12 months measured. Most districts sit closer together: the middle 80% of England spans 25.2 to 40.5 items, a spread of 1.6 times. The English average across all 296 local authority districts was 33.5 items per 1,000 patients per month.Which English local authority districts prescribe the most dermatology items?
Knowsley led England at 56.4 items per 1,000 registered patients per month in 2025/26, followed by Liverpool at 53.6, Sefton at 51.1, Birmingham at 50.5, Wirral at 50.2, St. Helens at 46.7 and Bradford at 45.9. Five of the top seven districts are in Merseyside. The concentration sits in metropolitan districts of the North West, West Midlands and West Yorkshire.Is NHS dermatology prescribing seasonal?
Only weakly. National prescribing moved within a 14% band in 2025/26, from 31.3 items per 1,000 patients in February 2026 to 35.6 in July 2025. The series does not form a clean seasonal curve: August 2025 sat at 31.6, close to the annual low, and March 2026 reached 34.8. The whole national swing across 12 months is smaller than the gap between many neighbouring districts.Does low NHS dermatology prescribing mean low need for skin care?
No. The English Prescribing Dataset records items dispensed against NHS prescriptions in primary care only. It does not capture private prescriptions, over-the-counter purchase, hospital-issued treatment, or need that never reaches a GP. The six lowest districts, Gravesham at 18.7, Dartford at 19.7, Kensington and Chelsea at 20.3, City of London at 21.6, Hammersmith and Fulham at 21.8 and Medway at 22.1, could reflect any of those. Distinguishing them needs prevalence and access data this dataset does not hold.What data is this NHS dermatology prescribing analysis based on?
The NHS Business Services Authority English Prescribing Dataset for the 2025/26 financial year, April 2025 to March 2026. GP practice-level records were aggregated to local authority district, giving 296 English districts and 3,552 district-months with no gaps, and normalised to items per 1,000 registered patients per month. Dermatology prescribing covers British National Formulary Chapter 13, skin. Totals across the year: 25.6 million items and £287 million of prescribing cost.What does the £287 million of NHS dermatology prescribing cover?
It is the total prescribing cost recorded in the English Prescribing Dataset for British National Formulary (BNF) Chapter 13, skin, dispensed in English primary care between April 2025 and March 2026. That chapter covers topical corticosteroids, emollients and barrier preparations, antifungals and antibacterials, acne and rosacea preparations, antipsoriatics, wound management and scalp preparations. It is NHS primary care cost only, and excludes hospital-issued and privately prescribed treatment.Why is NHS dermatology prescribing so high in Merseyside?
This analysis cannot say. Five Merseyside districts, Knowsley, Liverpool, Sefton, Wirral and St. Helens, sit among the seven highest in England, all above 46 items per 1,000 registered patients per month and roughly 40% above the English average. Prescribing volume measures treatment dispensed, not prevalence, so a higher burden of skin disease and higher rates of presentation and treatment in primary care are both consistent with these figures. Separating them needs a prevalence source the prescribing record does not contain.How should NHS commissioners read these district prescribing figures?
As a prompt for local enquiry rather than a conclusion. The district is the useful unit here: a gap of 3.0 times between the highest and lowest districts, holding in every month of the year, is a structural feature rather than a seasonal one, while the national average of 33.5 items per 1,000 registered patients per month describes no district in particular. The six districts below 23 items per 1,000 patients per month warrant the closest look, because prescribing volume alone cannot separate healthier skin from care obtained elsewhere from need that is going untreated.
Methodology
Register: public-health. Primary source: the NHS Business Services Authority English Prescribing Dataset (EPD), financial year 2025/26, covering April 2025 to March 2026 inclusive. The EPD records every prescription item dispensed in English primary care, published monthly at NHSBSA Open Data, and adds roughly 17 million items each month across all therapeutic areas.
Dermatology is defined as British National Formulary (BNF) Chapter 13, Skin, taken as a combined all-category view. Practice-level dispensing is aggregated to the 296 English local authority districts carried in the Office for National Statistics (ONS) district file, covering the E06, E07, E08 and E09 code ranges. Rates are items per 1,000 registered patients per month, using each district's registered list size, so a large district and a small one can be compared directly. Counts are prescription items, not patients and not prevalence: one patient collecting a repeat every month contributes 12 items.
The window is 12 months. Every figure quoted in this report was recomputed twice from two independent files, the source extract and the data file the interactive map itself loads, and both agree to one decimal place after rounding. Where the two disagreed, the underlying arithmetic was rerun rather than either figure being carried forward: Hammersmith and Fulham is 21.8, not 21.9.
Three limits are worth stating plainly. Prescribing counts treatment, not need, so a low rate can mean less skin disease or care that is not reaching a prescriber, and this dataset cannot separate the two. Items dispensed in hospital outpatient settings and in private practice are outside the EPD, so this is an NHS primary care picture only. And a district's registered list is not identical to its resident population, which matters most in central London, where registration and residence diverge widely.
Related content
Where Ireland's physiotherapy cover is thinnest
NHS orthodontic completion rates were higher in areas with lower health deprivation
Analysis of the English orthodontic market shows huge variation in case completion across English ICBs, and highlights that less health-deprived areas record more completed treatments per 100,000 people.
Diabetes in England follows the postcode
People living in England's most deprived neighbourhoods are nearly three times as likely to have diabetes as those in the least deprived. The Health Survey for England 2024 also confirms a substantial undiagnosed share: around one in five cases.