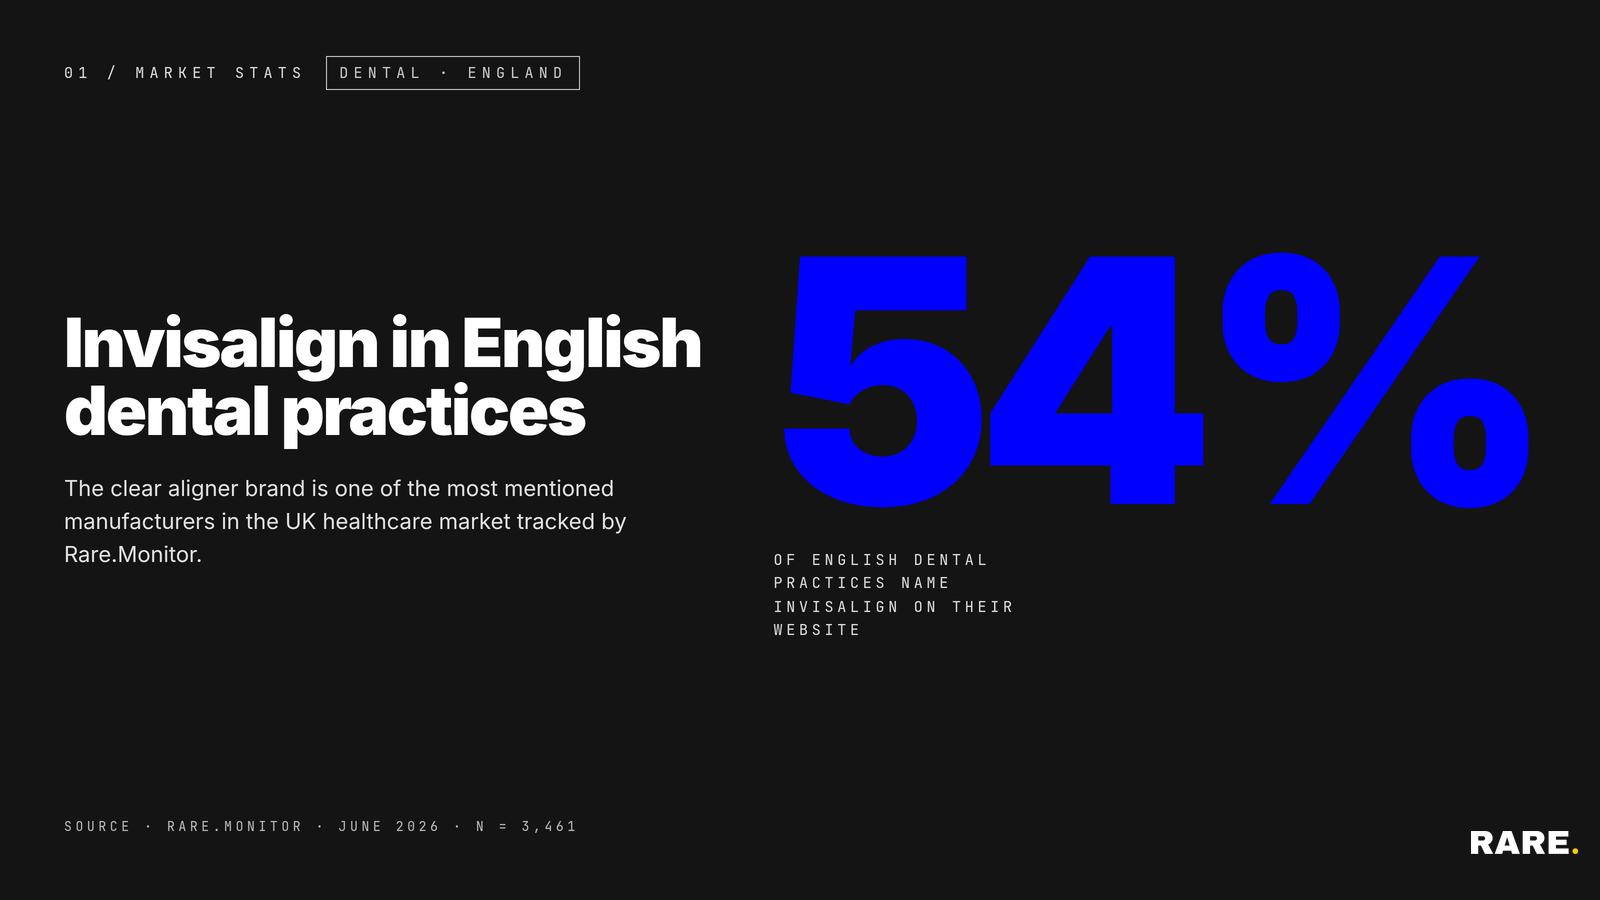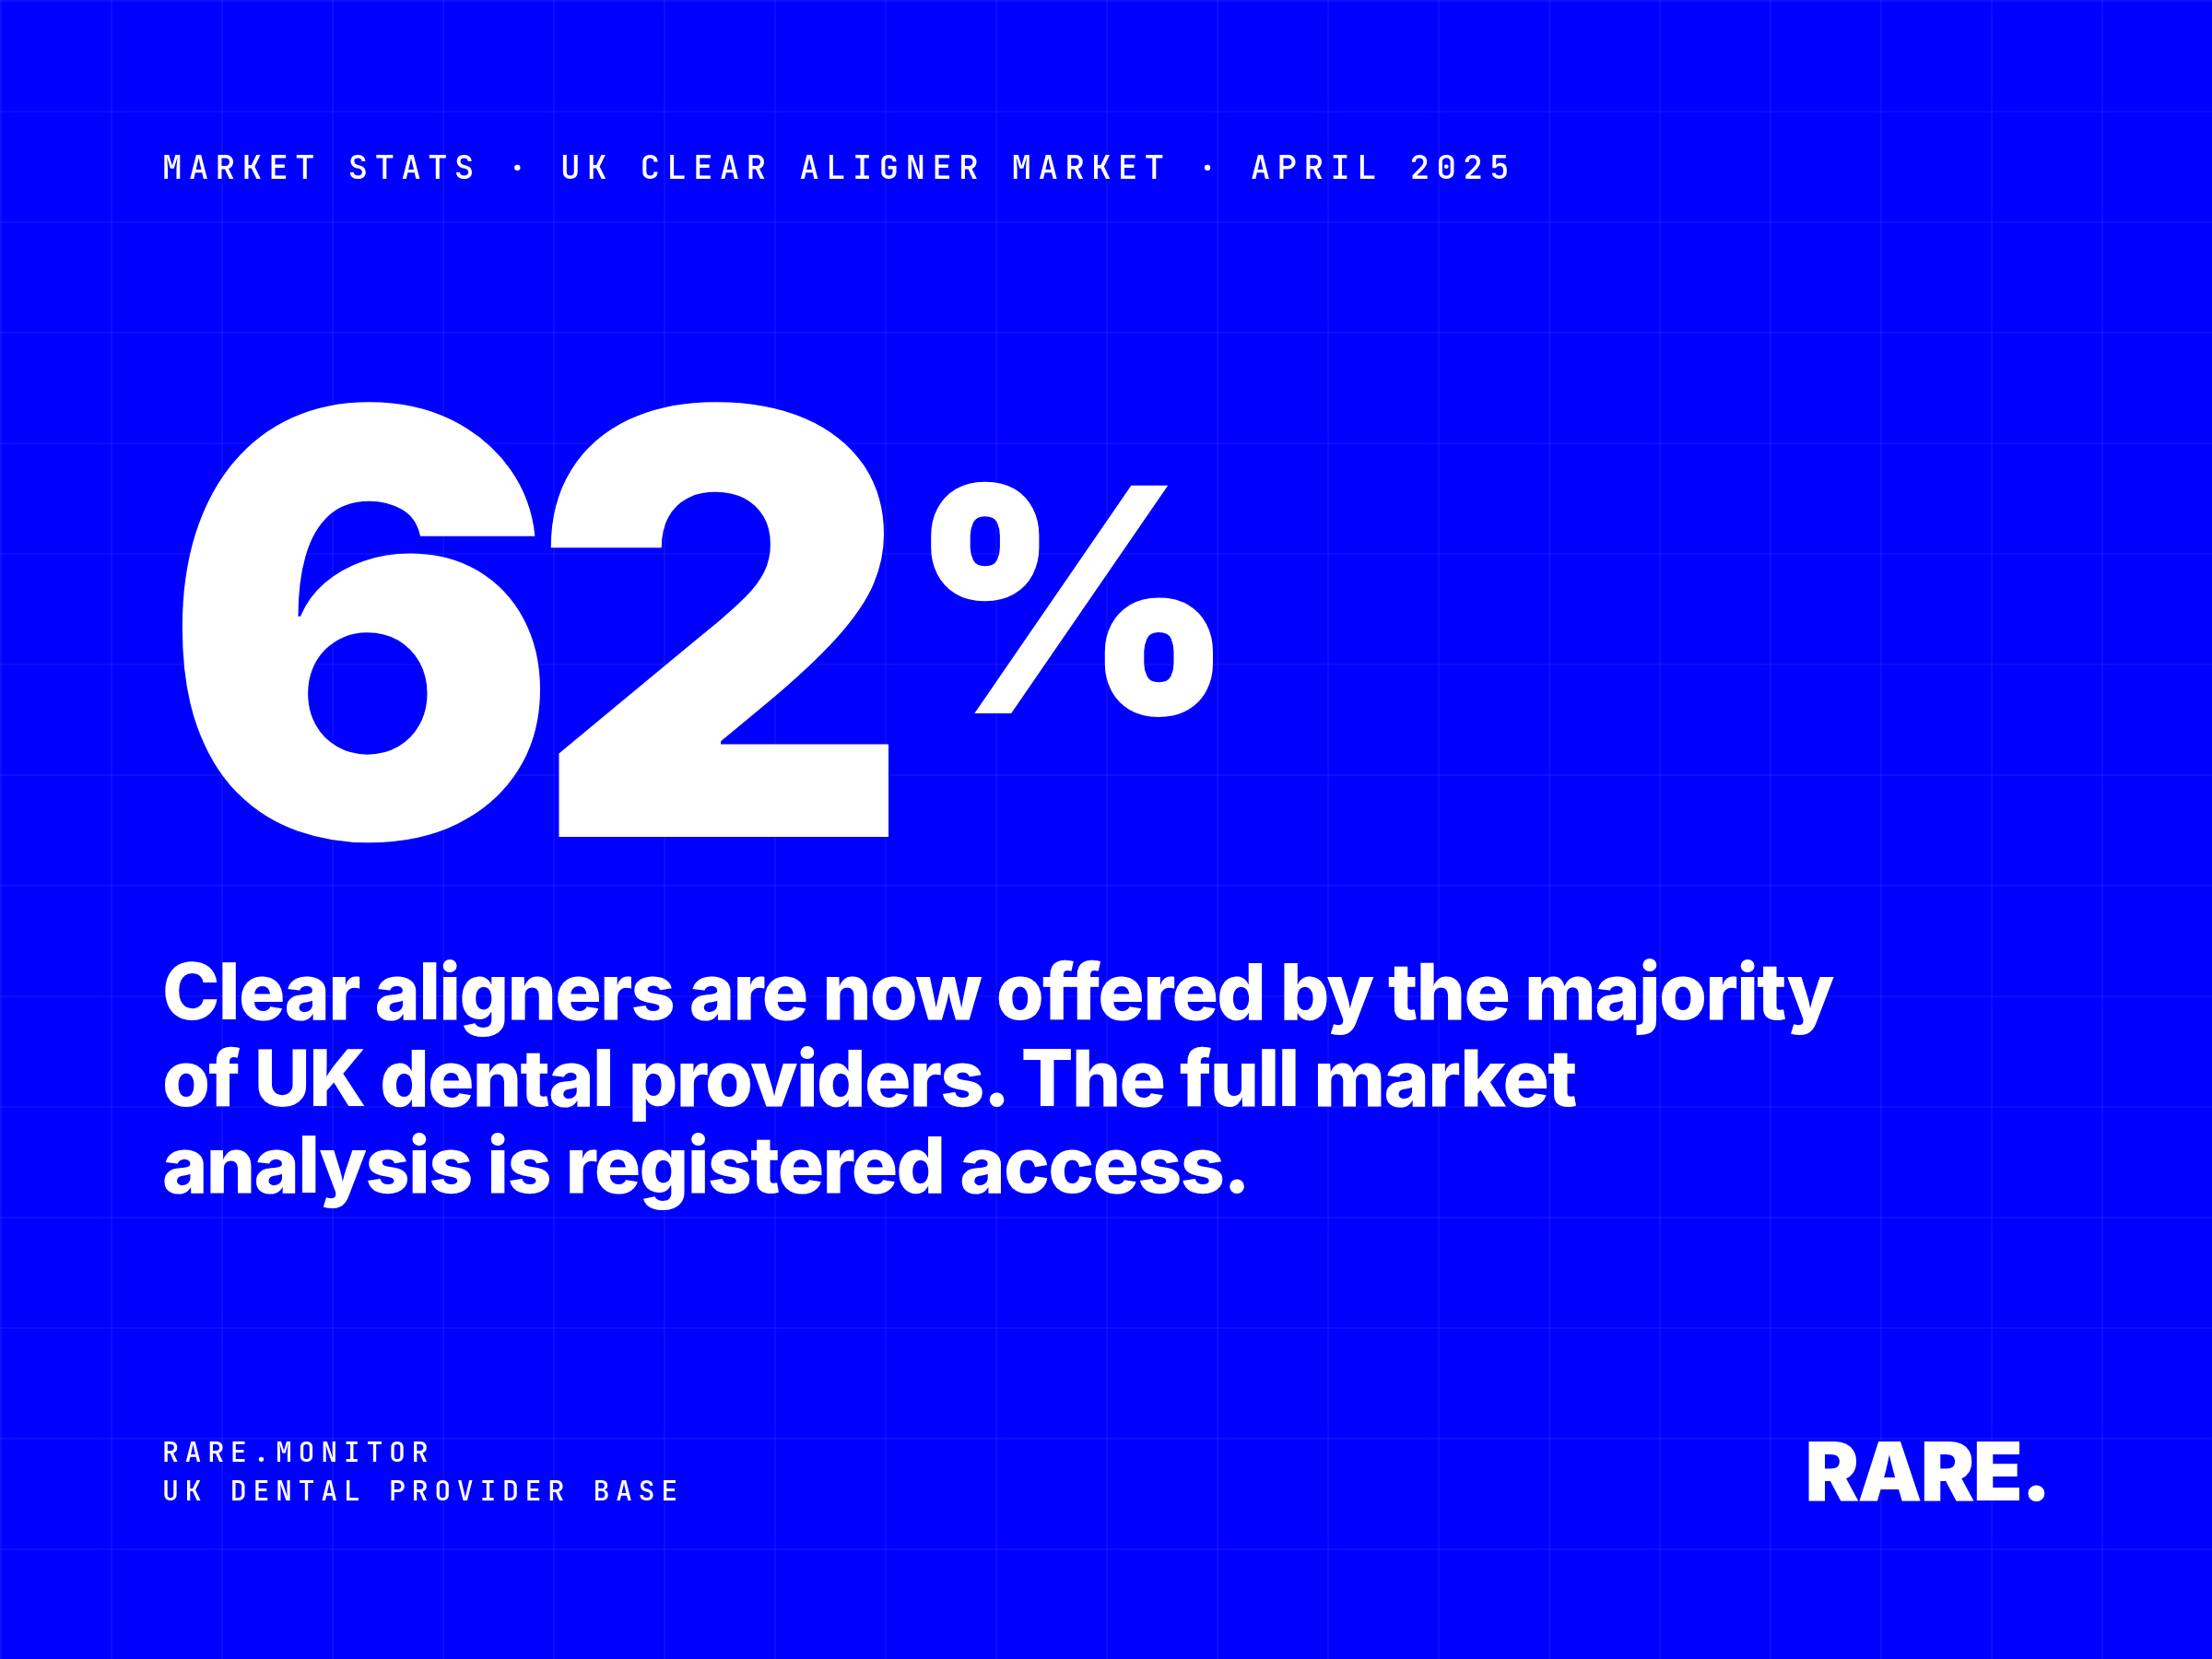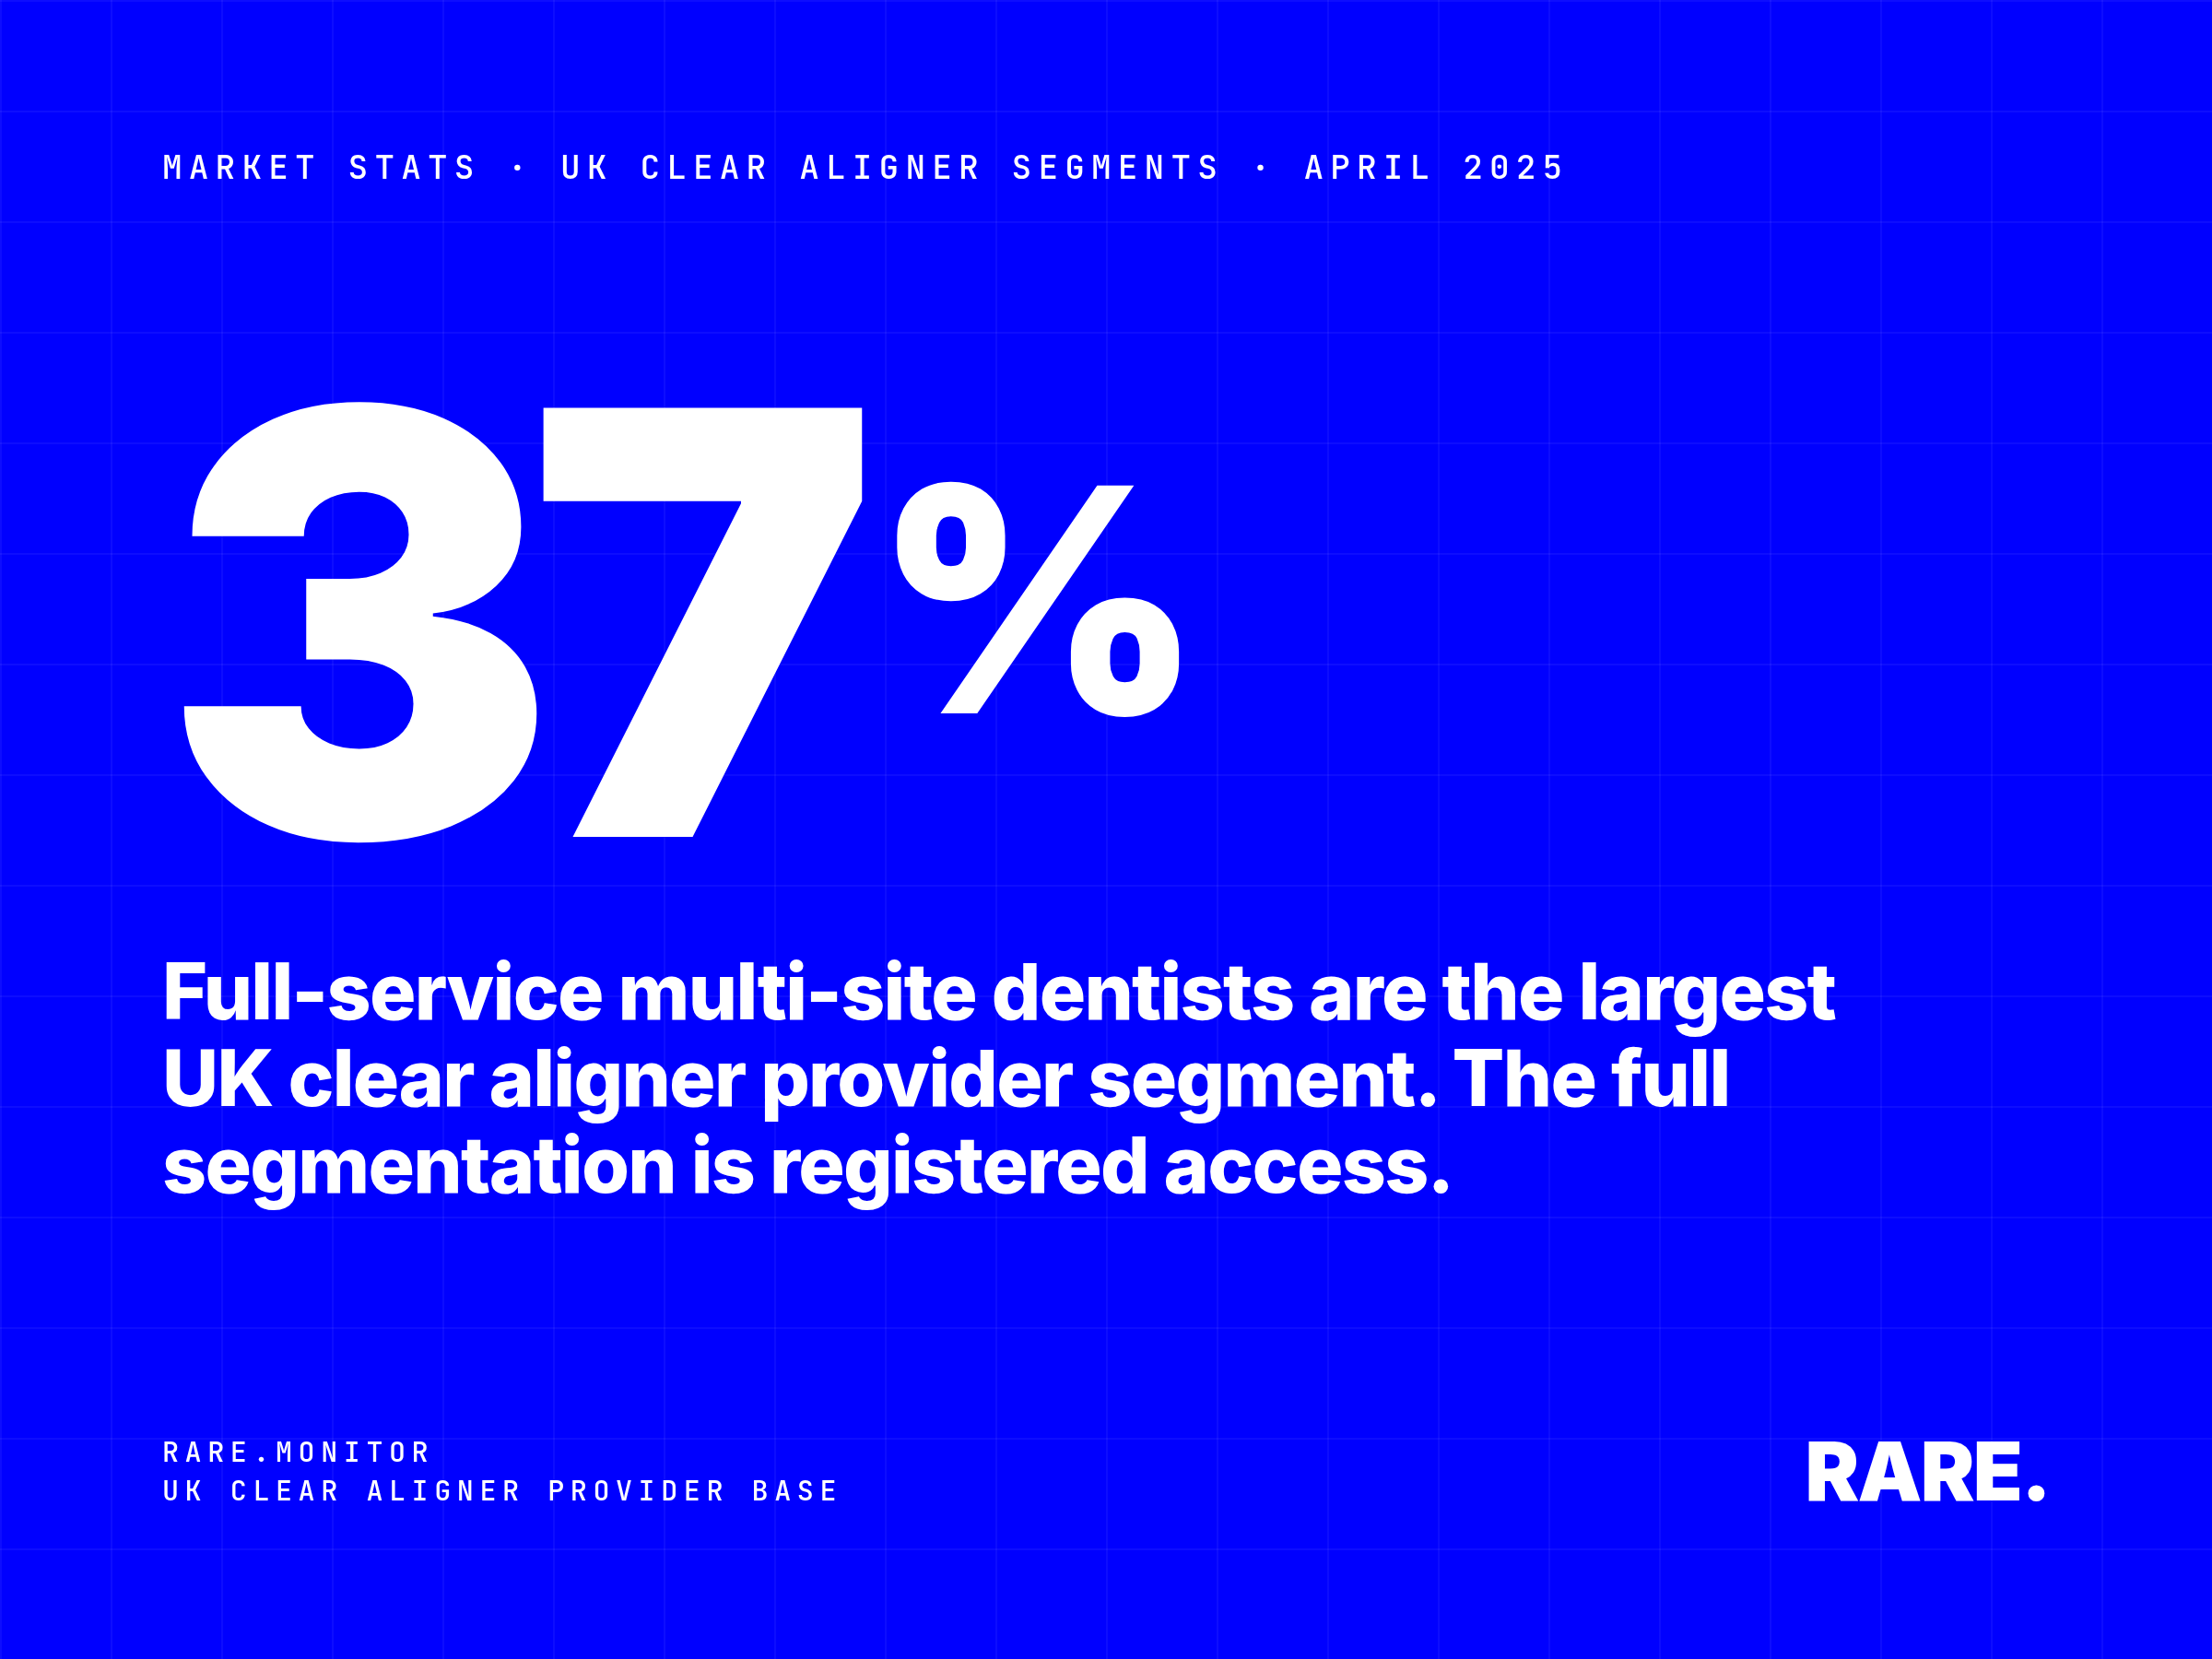

Analysis of the English orthodontic market shows huge variation in case completion across English ICBs, and highlights that less health-deprived areas record more completed treatments per 100,000 people.
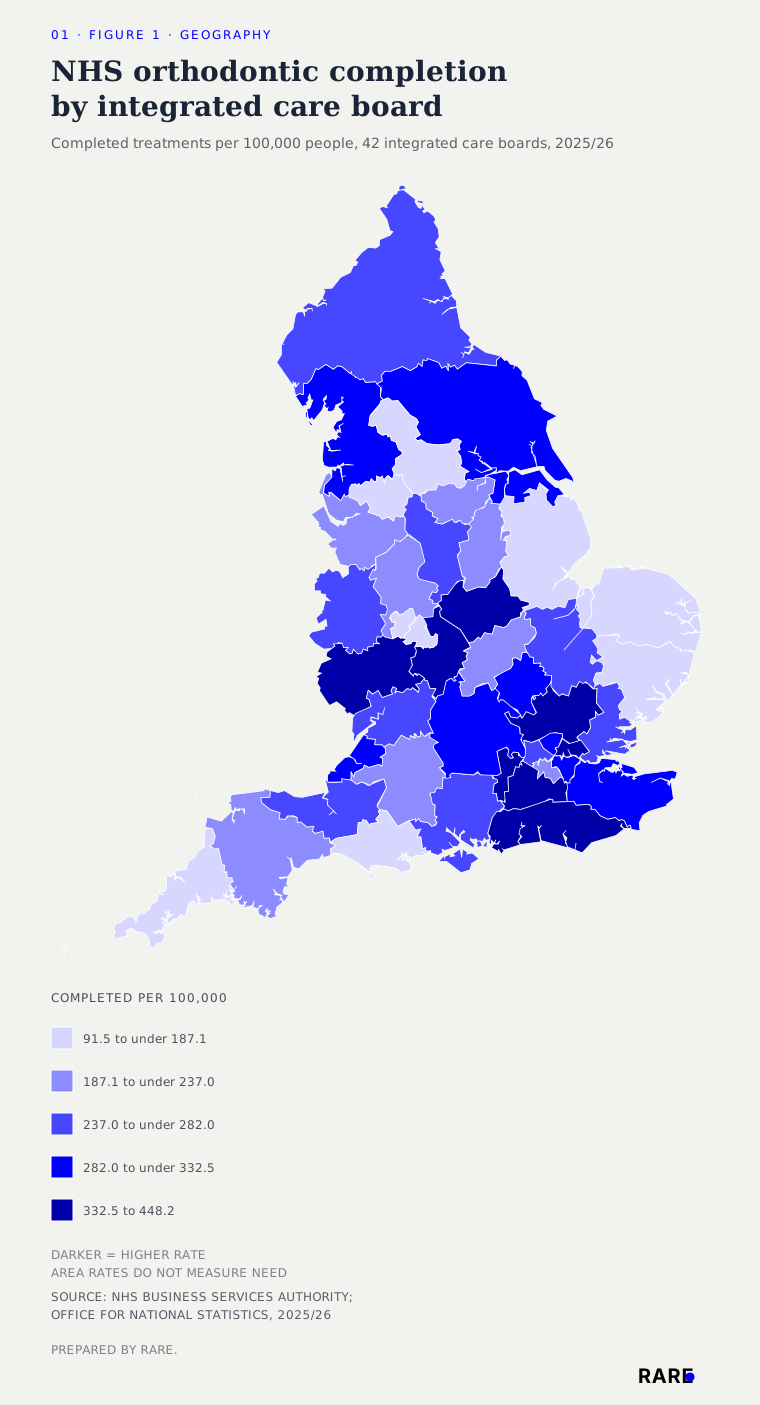
Completed NHS orthodontic treatment rates were higher in areas with lower health deprivation. Across England's 42 integrated care boards (ICBs) in 2025/26, rates ranged from 91.5 per 100,000 people in Lincolnshire to 448.2 in Hertfordshire and West Essex. That is a 4.9-fold difference, and it maps imperfectly but consistently onto health deprivation.
A nearly fivefold gap separates the highest and lowest areas
Providers recorded 150,011 completed orthodontic treatments in England during 2025/26, alongside 106,626 starts and 2.37 million units of orthodontic activity (UOAs). Completions can exceed starts within a financial year because they are not the same patient cohort.
The NHS Business Services Authority counts a start when an FP17O (the NHS orthodontic treatment claim form) records that treatment began, and a completion when an FP17O records it ending. A course that finished in 2025/26 may have started in an earlier year.
Population-adjusted rates expose variation that the raw data hides. Lincolnshire's 703 completed treatments look low until you account for its population; Hertfordshire and West Essex's 6,715 look high until you do the same.
Less health-deprived areas tended to record more completed treatments per head
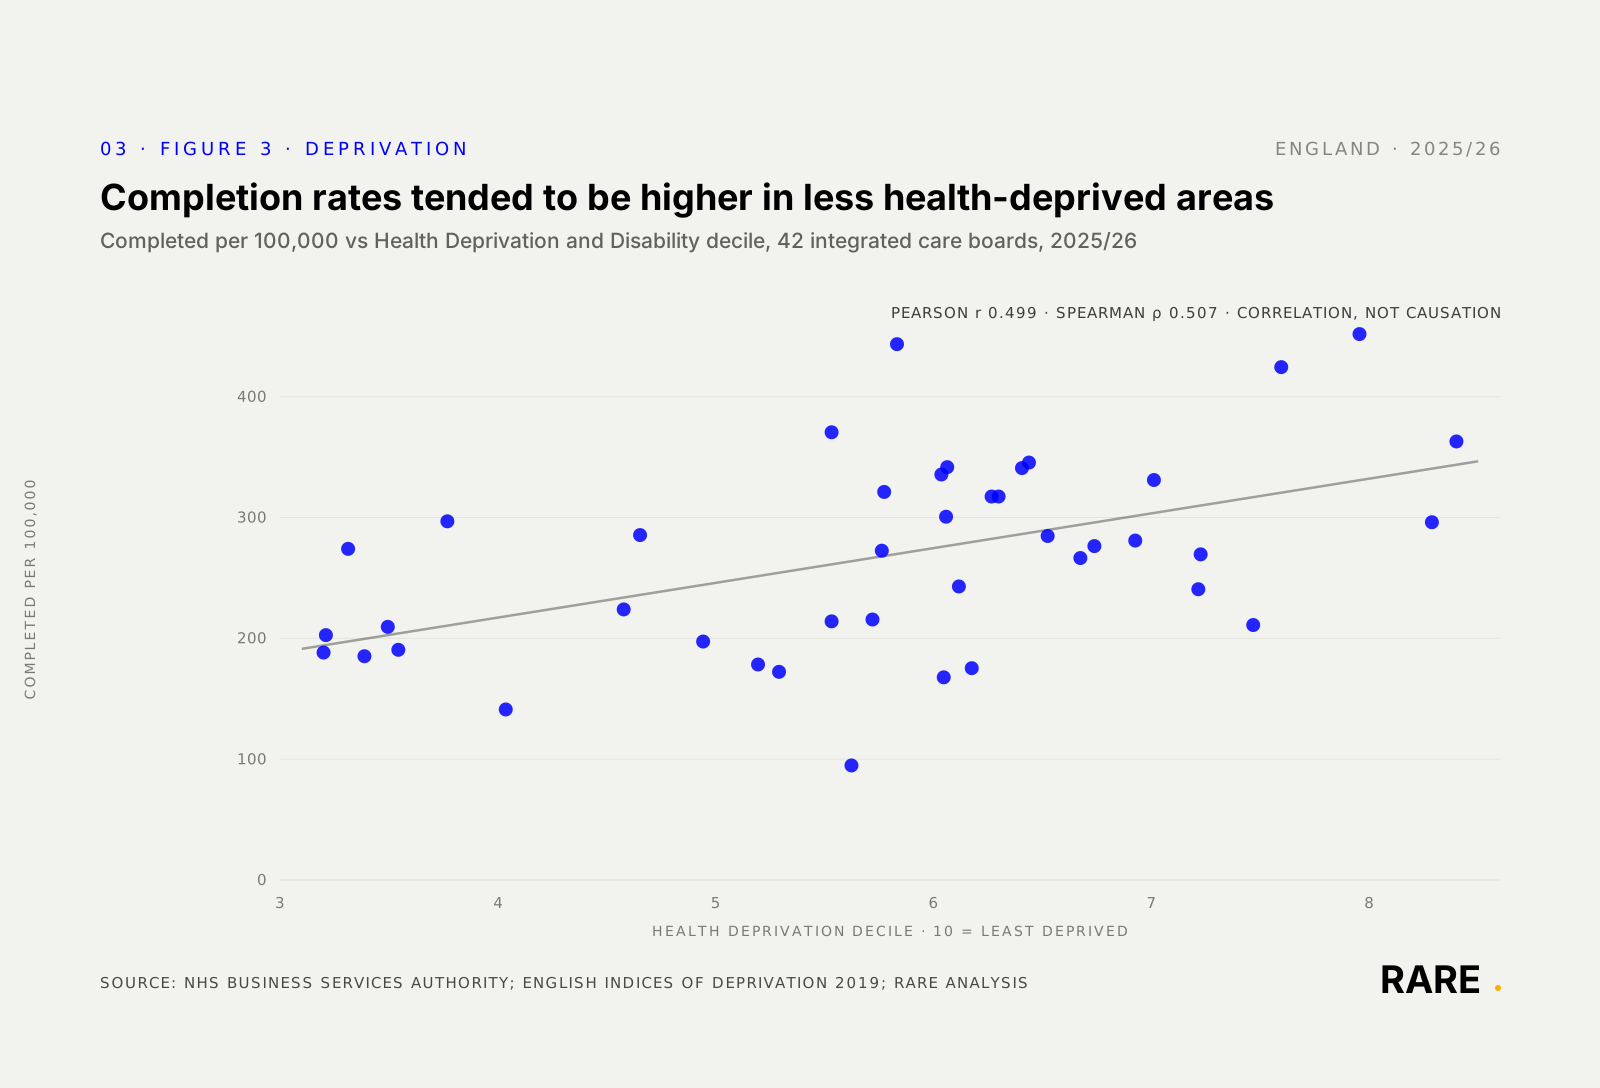
The Health Deprivation and Disability Domain decile had a moderate positive correlation with completed treatments per 100,000 people. A higher decile means less deprivation.
This is an area-level association only. The analysis does not establish whether deprivation constrains access, whether other geographic factors drive both variables, or whether the direction of causation can be inferred at all.
Which areas recorded the most and fewest completed treatments?
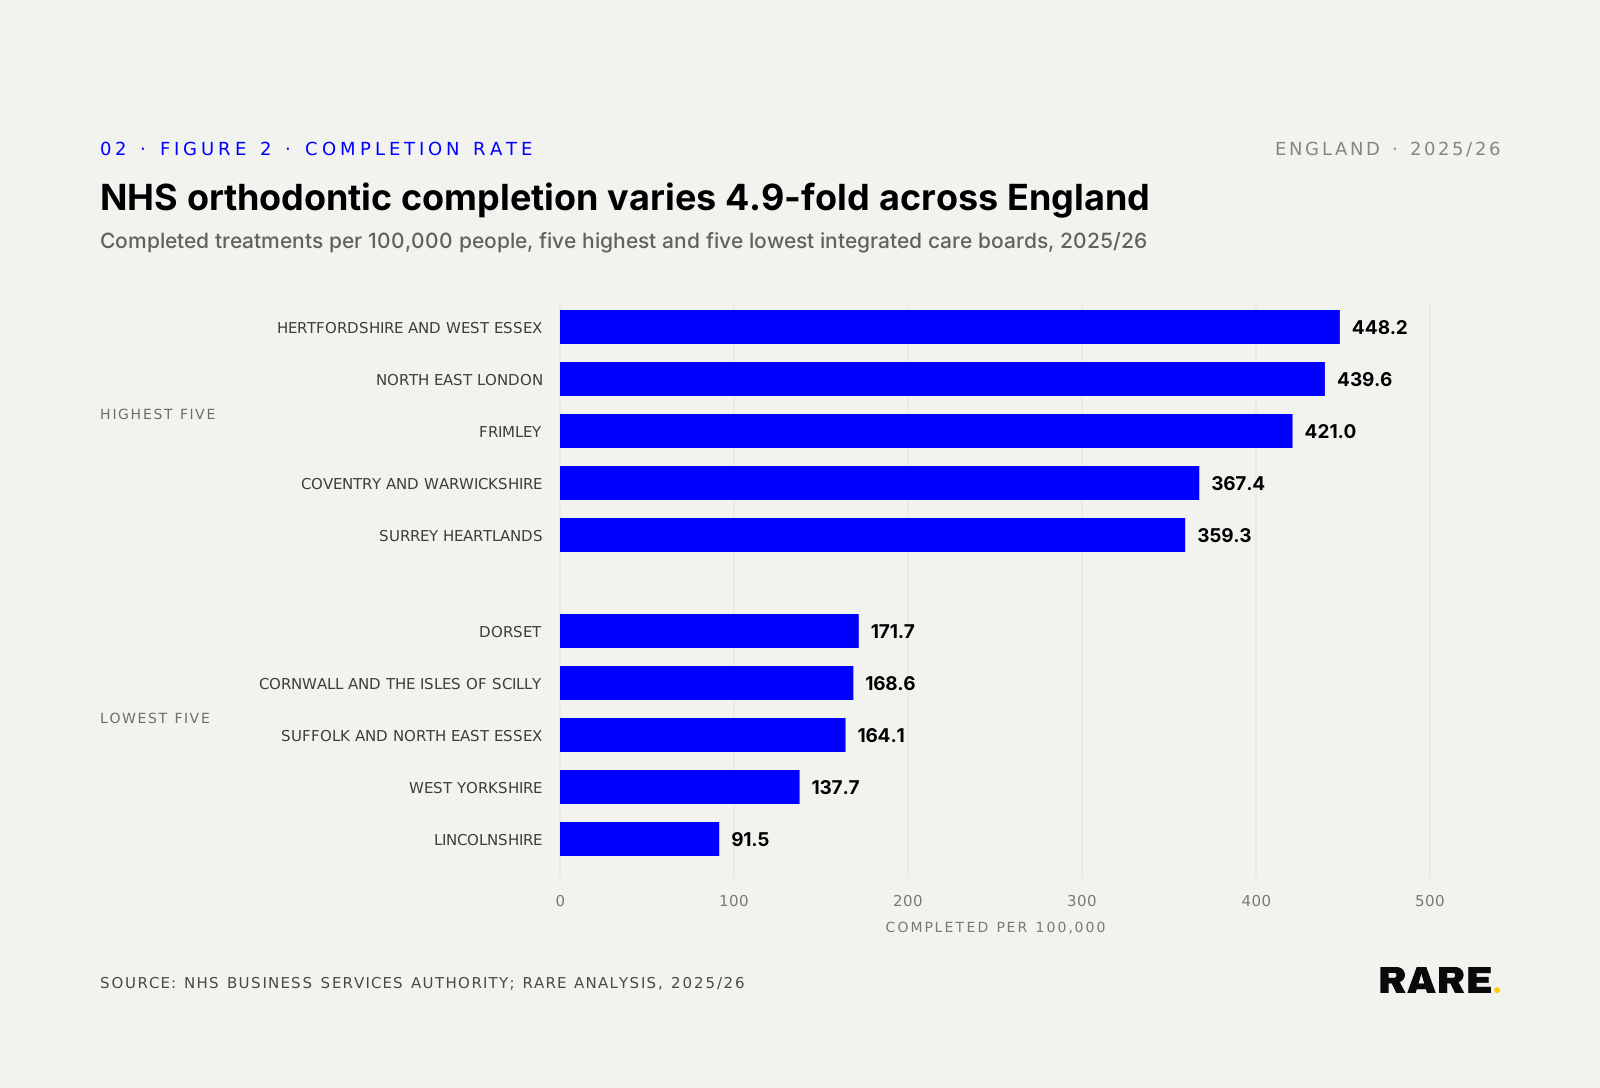
Hertfordshire and West Essex recorded the highest rate, 448.2 completed treatments per 100,000 people. Lincolnshire recorded the lowest, 91.5. Read that as a north-south divide and you would be wrong: the Midlands holds both the lowest area and the fourth-highest, Coventry and Warwickshire, and the East of England the highest and the third-lowest, Suffolk and North East Essex.
Rank | Integrated care board | Completed per 100,000 |
|---|---|---|
1 (highest) | Hertfordshire and West Essex | 448.2 |
2 | North East London | 439.6 |
3 | Frimley | 421.0 |
4 | Coventry and Warwickshire | 367.4 |
5 | Surrey Heartlands | 359.3 |
38 | Dorset | 171.7 |
39 | Cornwall and the Isles of Scilly | 168.6 |
40 | Suffolk and North East Essex | 164.1 |
41 | West Yorkshire | 137.7 |
42 (lowest) | Lincolnshire | 91.5 |
The pattern does not establish what is causing it
Several factors shape these rates independently of deprivation. NHS orthodontic treatment is concentrated among younger people, while the population denominator covers all usual residents from the 2021 Census. Areas with younger age profiles may record higher rates for demographic reasons rather than access reasons.
Commissioning arrangements, provider capacity, treatment duration, claim timing and patient movement across ICB boundaries may also play a role. The dataset records activity delivered under NHS orthodontic contracts. It does not measure unmet need, waiting times, clinical eligibility, private orthodontic treatment or patient outcomes.
The NHS Business Services Authority classifies this source as management information rather than official statistics. The Health Deprivation and Disability Domain was used because it had complete, traceable official inputs at small-area level. It is an exploratory contextual measure, not a direct measure of socioeconomic disadvantage.
The association should be retested against the overall Index of Multiple Deprivation, and against relevant income and education domains, before it is interpreted as an access gradient.
A separate clear-aligner comparison did not show the same geographic relationship
Using data from Rare.Monitor, we wanted to understand whether there was a similar relationship between health deprivation and the presence of private clear aligner distribution, using online mentions of clear aligner treatment.
The prevalence of clear-aligner mentions on clinic websites showed no detectable relationship with health deprivation across the same 42 areas, at 0.069 (p=0.664).
All 42 integrated care boards ranked
The complete ranking below covers all 42 geographic integrated care boards on the same population-adjusted basis, from Hertfordshire and West Essex at 448.2 completed treatments per 100,000 people down to Lincolnshire at 91.5. Counts of completed treatments sit alongside the rates, so you can see what the population adjustment changes.
Rank | Integrated care board | Completed per 100,000 | Completed treatments |
|---|---|---|---|
1 | Hertfordshire and West Essex | 448.2 | 6,715 |
2 | North East London | 439.6 | 8,787 |
3 | Frimley | 421.0 | 3,218 |
4 | Coventry and Warwickshire | 367.4 | 3,461 |
5 | Surrey Heartlands | 359.3 | 3,771 |
6 | Herefordshire and Worcestershire | 342.2 | 2,706 |
7 | Leicester, Leicestershire and Rutland | 338.2 | 3,795 |
8 | Sussex | 337.6 | 5,759 |
9 | Bristol, North Somerset and South Gloucestershire | 332.5 | 3,257 |
10 | North Central London | 327.9 | 4,624 |
11 | Humber and North Yorkshire | 317.8 | 5,394 |
12 | Kent and Medway | 314.2 | 5,831 |
13 | Bedfordshire, Luton and Milton Keynes | 314.0 | 3,136 |
14 | South East London | 296.9 | 5,318 |
15 | Lancashire and South Cumbria | 293.3 | 5,037 |
16 | Buckinghamshire, Oxfordshire and Berkshire West | 292.9 | 5,208 |
17 | Derby and Derbyshire | 282.0 | 2,978 |
18 | Hampshire and Isle of Wight | 280.9 | 5,124 |
19 | Mid and South Essex | 277.4 | 3,327 |
20 | Gloucestershire | 273.2 | 1,762 |
21 | North East and North Cumbria | 271.0 | 8,038 |
22 | Shropshire, Telford and Wrekin | 269.5 | 1,372 |
23 | North West London | 266.2 | 5,572 |
24 | Cambridgeshire and Peterborough | 262.9 | 2,405 |
25 | Somerset | 239.5 | 1,369 |
26 | Bath and North East Somerset, Swindon and Wiltshire | 237.0 | 2,236 |
27 | Nottingham and Nottinghamshire | 220.6 | 2,534 |
28 | Northamptonshire | 211.9 | 1,664 |
29 | Devon | 211.0 | 2,565 |
30 | South West London | 207.5 | 3,126 |
31 | Cheshire and Merseyside | 206.0 | 5,189 |
32 | South Yorkshire | 199.3 | 2,740 |
33 | Staffordshire and Stoke-on-Trent | 194.4 | 2,205 |
34 | Birmingham and Solihull | 187.1 | 2,547 |
35 | Greater Manchester | 184.9 | 5,301 |
36 | Black Country | 181.6 | 2,203 |
37 | Norfolk and Waveney | 174.7 | 1,804 |
38 | Dorset | 171.7 | 1,339 |
39 | Cornwall and the Isles of Scilly | 168.6 | 965 |
40 | Suffolk and North East Essex | 164.1 | 1,617 |
41 | West Yorkshire | 137.7 | 3,309 |
42 | Lincolnshire | 91.5 | 703 |
An association, not an explanation
The 4.9-fold range in NHS orthodontic completion rates across England, from 91.5 to 448.2 completed treatments per 100,000 people, is real and substantial. The moderate correlation with health deprivation, Pearson 0.499, is statistically robust at area level. What it does not settle is why.
Age structure, commissioning history, provider distribution and claim timing are all plausible contributors that this dataset cannot separate.
Retesting the correlation against income and education deprivation domains, and against a population denominator limited to children likely to qualify for NHS orthodontics, would help distinguish access effects from demographic ones. That analysis sits outside the scope of this dataset alone.
For further context on private orthodontic provision, see the UK clear-aligner market analysis and the June 2026 Invisalign brand-penetration analysis.
Methodology: Rare. analysed English Contractor Monthly Orthodontic Activity management information from the NHS Business Services Authority for April 2025 to March 2026. Activity was aggregated to 42 geographic integrated care boards. Rates per 100,000 use Census 2021 usual-resident counts, joined for all 35,672 English lower-layer super output areas to the April 2023 official ICB lookup. One non-geographic commissioner (HJ1 H&J North East and Yorkshire) was excluded because it recorded one contract and no activity. The English Indices of Deprivation 2019 Health Deprivation and Disability Domain decile was population-weighted to ICB level. The analysis tested 16 variable pairings with Pearson and Spearman correlations, giving 32 coefficient tests and a Bonferroni-corrected threshold of 0.0015625. Sources accessed 6 August 2026.