Community pharmacy is rated good by 88% of patients in the 2025 GP Patient Survey, against 69.6% for GP practices. That structural eighteen-point gap is what makes pharmacy a credible destination for the consultation and clinical work NHS Pharmacy First is asking it to absorb. 2025 is the first full post-launch year and the data shows the channel doing what the policy intended, but along three distinct regional lines: South East for consultation, London for GP-routed referrals, North West for clinical services. South East referrals flow predominantly through 111 and A&E, not GPs.
Community pharmacy in England is rated good by 88.0% of patients in the 2025 GP Patient Survey, against 69.6% for GP practices. That eighteen-percentage-point gap, essentially stable across 2024 and 2025, is the structural advantage that makes pharmacy a credible destination for the consultation and clinical work the NHS Pharmacy First service launched in January 2024 is asking it to absorb. 2025 is the first full post-launch year, and the data shows the channel doing what the policy intended.
What does community pharmacy look like in 2025?
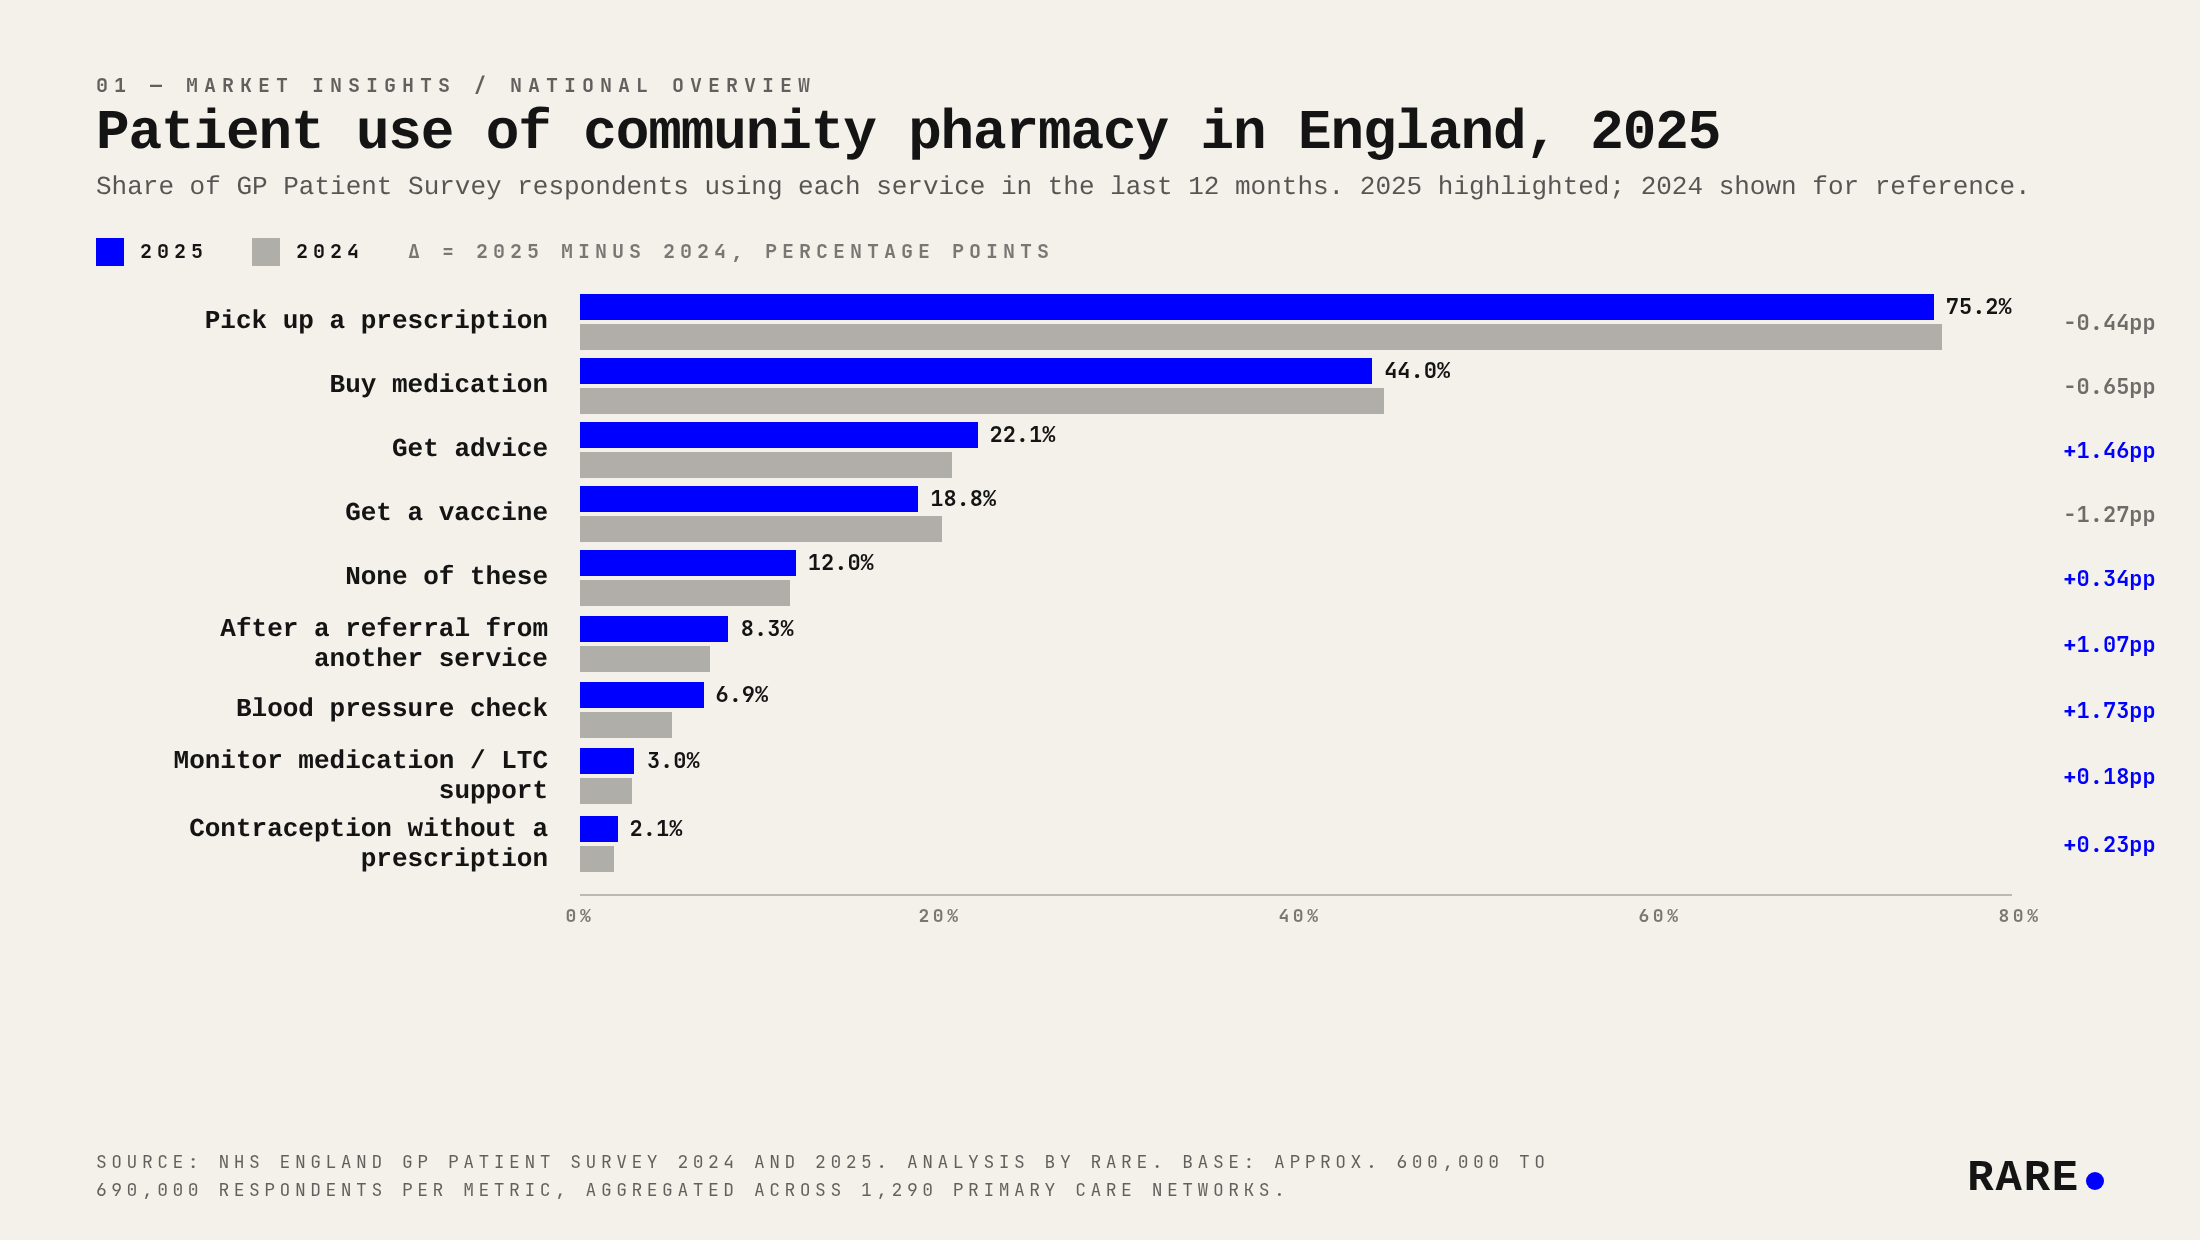
Three quarters of patients still pick up a prescription at their local pharmacy. That share hasn't moved much, from 75.7% in 2024 to 75.2% in 2025, and it isn't expected to. Dispensing is the historical core of what community pharmacies do and the volume anchor of the whole sector. What has changed sits underneath that anchor.
Metric | 2024 | 2025 | Δ |
|---|---|---|---|
Pick up a prescription | 75.7% | 75.2% | -0.44pp |
Buy medication | 44.7% | 44.0% | -0.65pp |
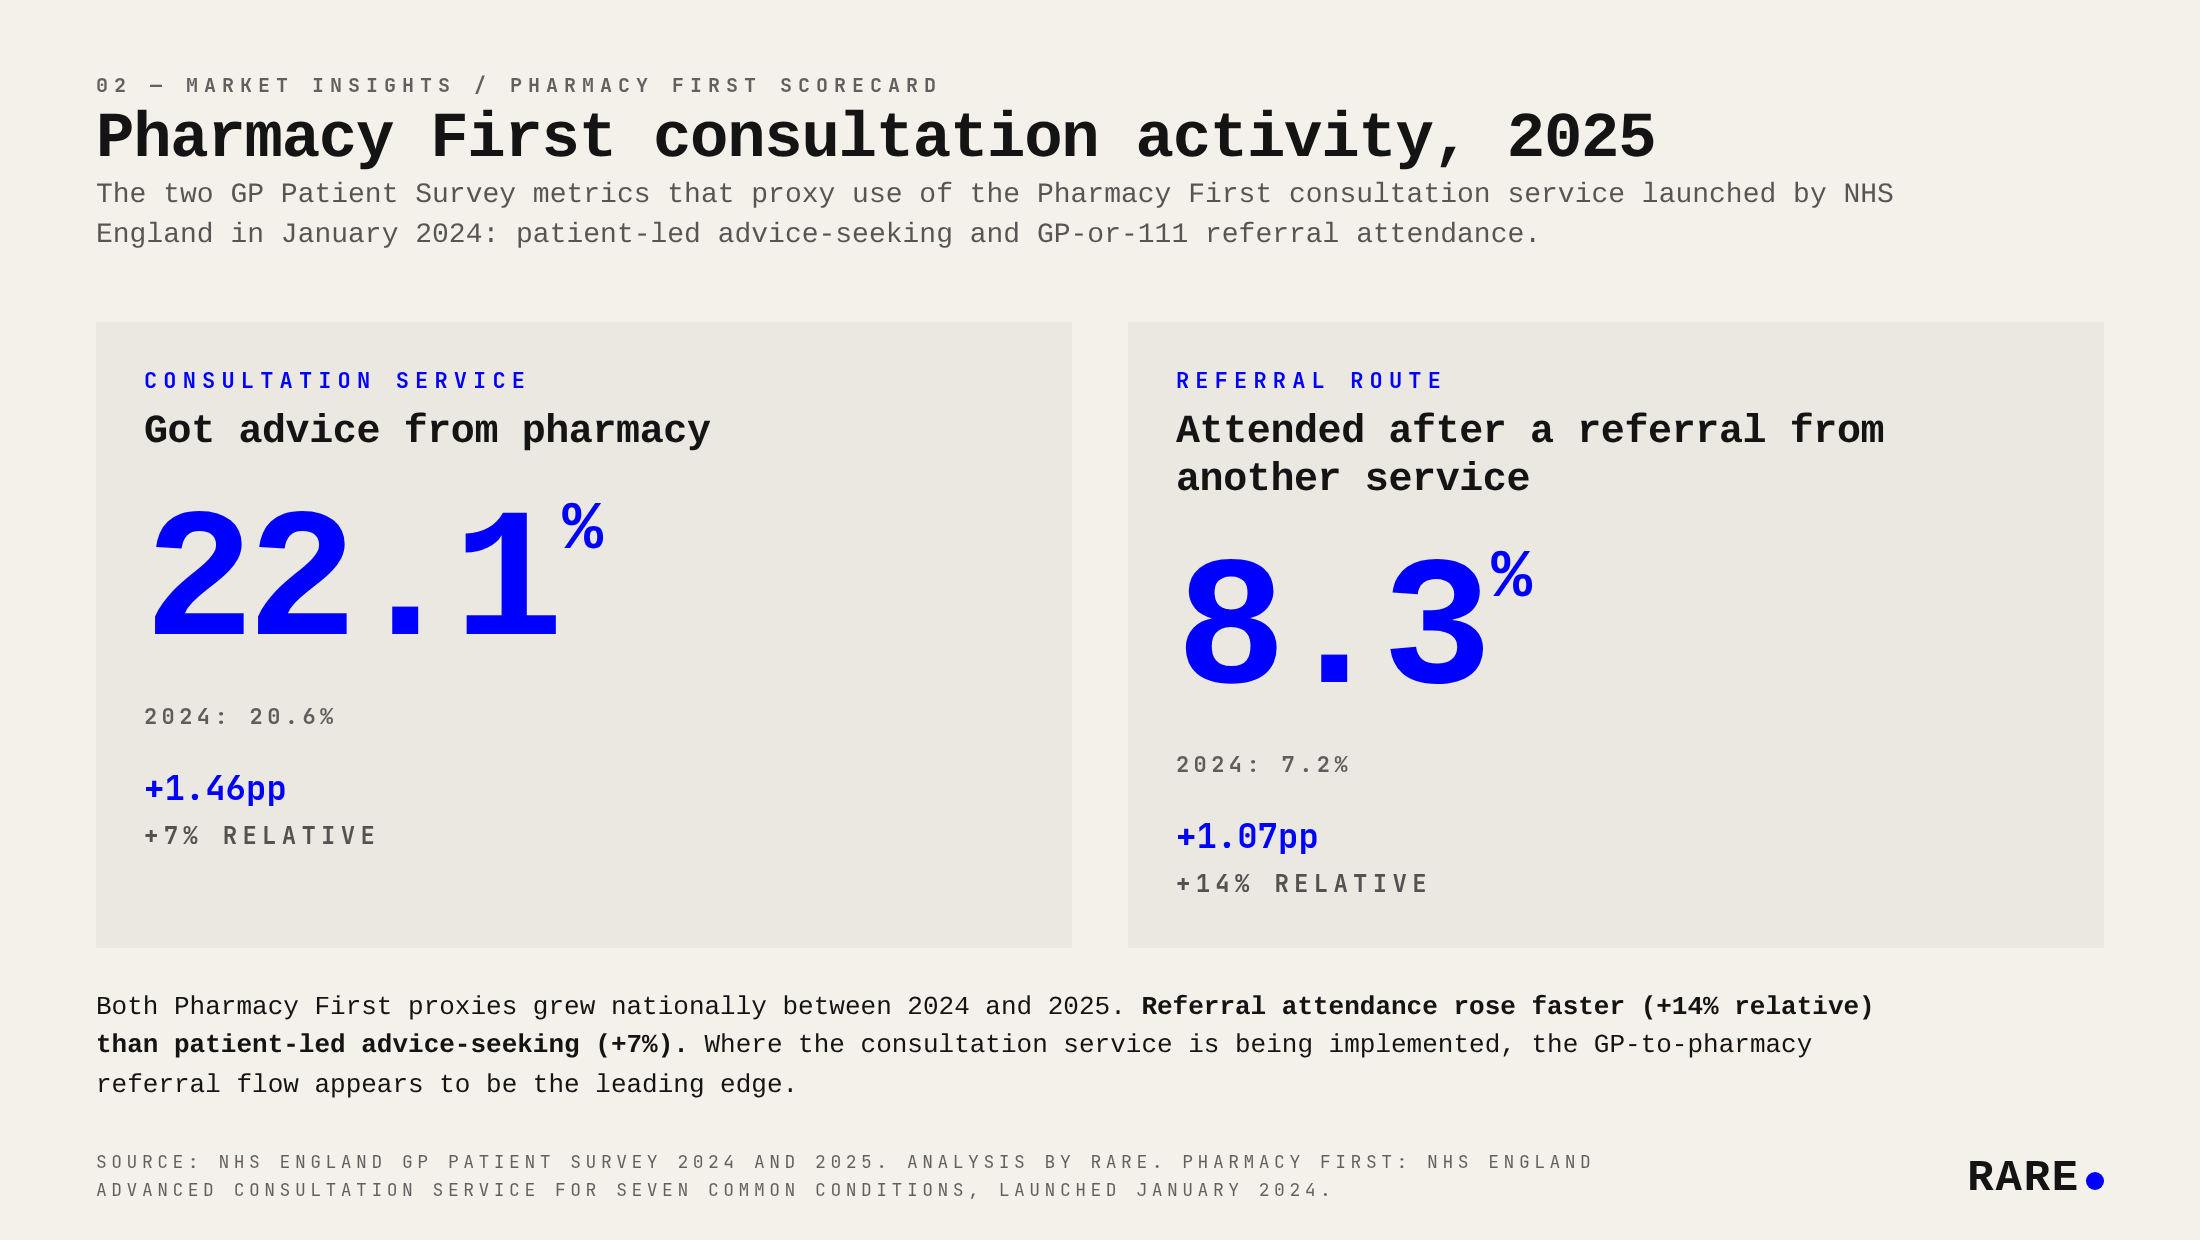
Get advice | 20.6% | 22.1% | +1.46pp |
Get a vaccine | 20.1% | 18.8% | -1.27pp |
After a referral from another service | 7.2% | 8.3% | +1.07pp |
Blood pressure check | 5.1% | 6.9% | +1.73pp |
Monitor medication / LTC support | 2.9% | 3.0% | +0.18pp |
None of these | 11.7% | 12.0% | +0.34pp |
Experience: summary good | 86.8% | 88.0% | +1.19pp |
Experience: very good | 49.6% | 51.6% | +1.98pp |
Experience: fairly poor | 3.2% | 2.8% | -0.43pp |
Experience: very poor | 1.6% | 1.3% | -0.31pp |
The biggest single mover is blood pressure checks: up 1.7 percentage points to 6.9% of patients. On a metric starting at 5%, that is a one-third year-on-year increase. Patient-led advice-seeking rose to 22.1% (up 1.46pp) and patients arriving at pharmacy after a referral from their GP, NHS 111 or A&E rose to 8.3% (up 1.07pp). Patient experience improved modestly while clinical-services volume grew. Capacity expansions in healthcare often come with a quality dip and there isn't one here.
One number that didn't move: the share of respondents who used pharmacy for none of the surveyed reasons is 12.0%, essentially unchanged from 11.7%. Engagement isn't fundamentally growing or shrinking. Patients aren't visiting pharmacy more often. They are using it differently when they do.
The exception is vaccinations: 18.8% in 2025, down from 20.1%. This is almost certainly post-pandemic normalisation working through. COVID booster uptake fell through 2024 and the flu programme has been quieter than its 2022 peak; pharmacy-delivered vaccinations track those national trends. It isn't evidence that pharmacy is doing less clinical work. Every other clinical metric points the other way.
How is Pharmacy First showing up in the survey?
The Pharmacy First service launched on 31 January 2024. It builds on the existing community pharmacist consultation service and lets community pharmacies treat seven common conditions, including sore throat, sinusitis and uncomplicated urinary tract infection in women, without a GP visit. The 2024 survey caught it in its first weeks. The 2025 survey is the first full post-launch year.
The survey doesn't ask about the seven specific conditions Pharmacy First covers, so the service can't be measured directly. It does ask about the two activities Pharmacy First was designed to drive: patient-led advice-seeking with a pharmacist, and patients routed into pharmacy by a referral from another service. Both rose. Referral attendance grew faster in relative terms (+14% on its 2024 base) than patient-led advice-seeking (+7%), consistent with a model where the GP and 111 routing path is the leading edge of where the service is being implemented on the ground.
None of the individual movements is dramatic. Taken together, they describe a system reorienting around clinical work. The composition of pharmacy footfall is shifting, gradually but in a clearly directional way.
Which English regions lead on Pharmacy First?
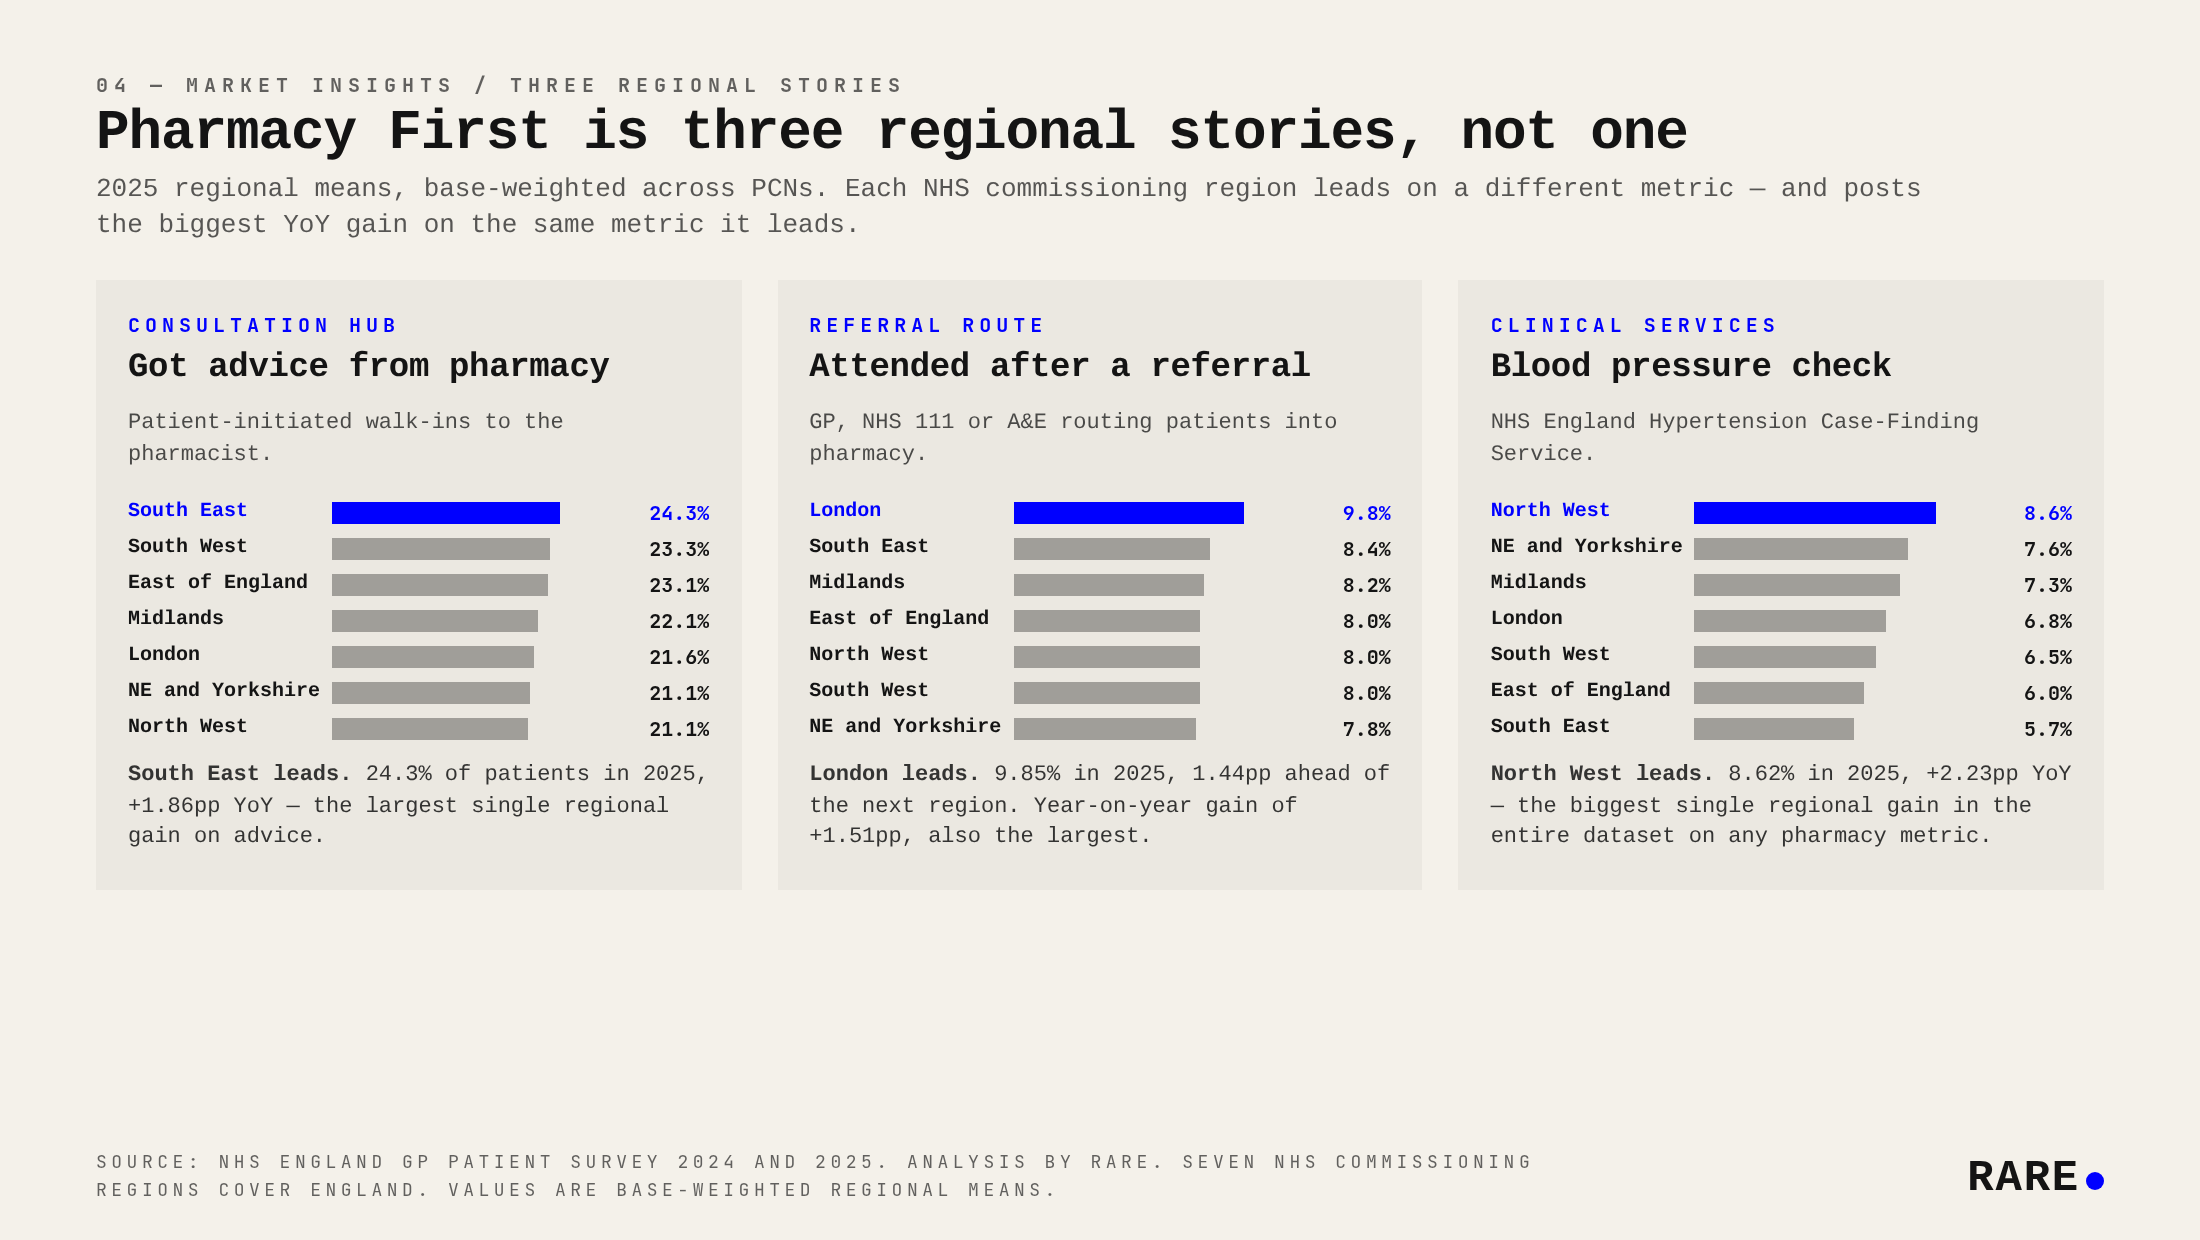
Within the national gain, regions are taking different paths. The two cleanest Pharmacy First signals in the survey, advice and referral, do not lead in the same place, and the older clinical-services signal, blood pressure check, leads somewhere else again. Three regions each lead on a different metric, and each posts the biggest year-on-year gain on the metric it leads.
South East is the consultation hub. 24.3% of South East patients got advice from a pharmacist in 2025, the highest in the country, with the largest single regional year-on-year gain (+1.86pp). Patient-initiated walk-ins are running through South East pharmacies at a higher rate than anywhere else.
London leads on system-routed referrals. 9.85% in 2025, 1.44pp ahead of the next region and 2.03pp ahead of the lowest. Year-on-year gain of +1.51pp, also the largest. Where the GP, NHS 111 and A&E referral pathway into pharmacy is most active, it's most active in London.
North West leads on clinical services. Blood pressure check at 8.62% in 2025, +2.23pp year on year. That is the biggest single regional gain in the dataset on any pharmacy metric. The clinical-services expansion has a strong northern footprint; the consultation expansion does not.
Read together, this isn't a single national rollout story. It is at least three distinct regional stories with different centres, each reinforcing year on year, plausibly reflecting different patterns of local commissioning and patient behaviour.
Who is sending patients to the pharmacy?
The patient-side referral metric, where patients tell the survey they attended a pharmacy after being referred from another service, only tells half the referral story. The GP-side of the survey adds the other half: the share of GP contacts that ended with the patient being told to go to a pharmacy.
Nationally, that GP-side share rose from 3.7% in 2024 to 4.0% in 2025, a smaller move than the patient-side referral figure (+1.1pp). The gap implies NHS 111 and A&E are doing a substantial share of the new routing work, not just GPs.
Regionally, the GP-side pattern is more concentrated than the patient-side one. London GPs route to pharmacy at 5.6%, roughly 50% above every other region. London's referral lead in the headline data isn't a 111 artefact: London GPs themselves are pushing it.
The North West is the fastest-growing region on the GP-side measure, up 0.56pp year on year. That reinforces the picture from blood pressure checks: the North West is the region building pharmacy fastest as a clinical destination, with both the physical-service expansion and the GP routing pattern pointing the same way.
The South East is the divergent case: high patient-side referrals (2nd nationally at 8.4%) but a below-average GP-side rate of 3.4%. South East referrals are flowing predominantly through 111 and A&E rather than directly from primary care. That has operational implications. Pharmacies in the South East are seeing referrals arrive, but they aren't coming from the GP relationships pharmacies most directly hold.
How much does Pharmacy First vary at PCN level?
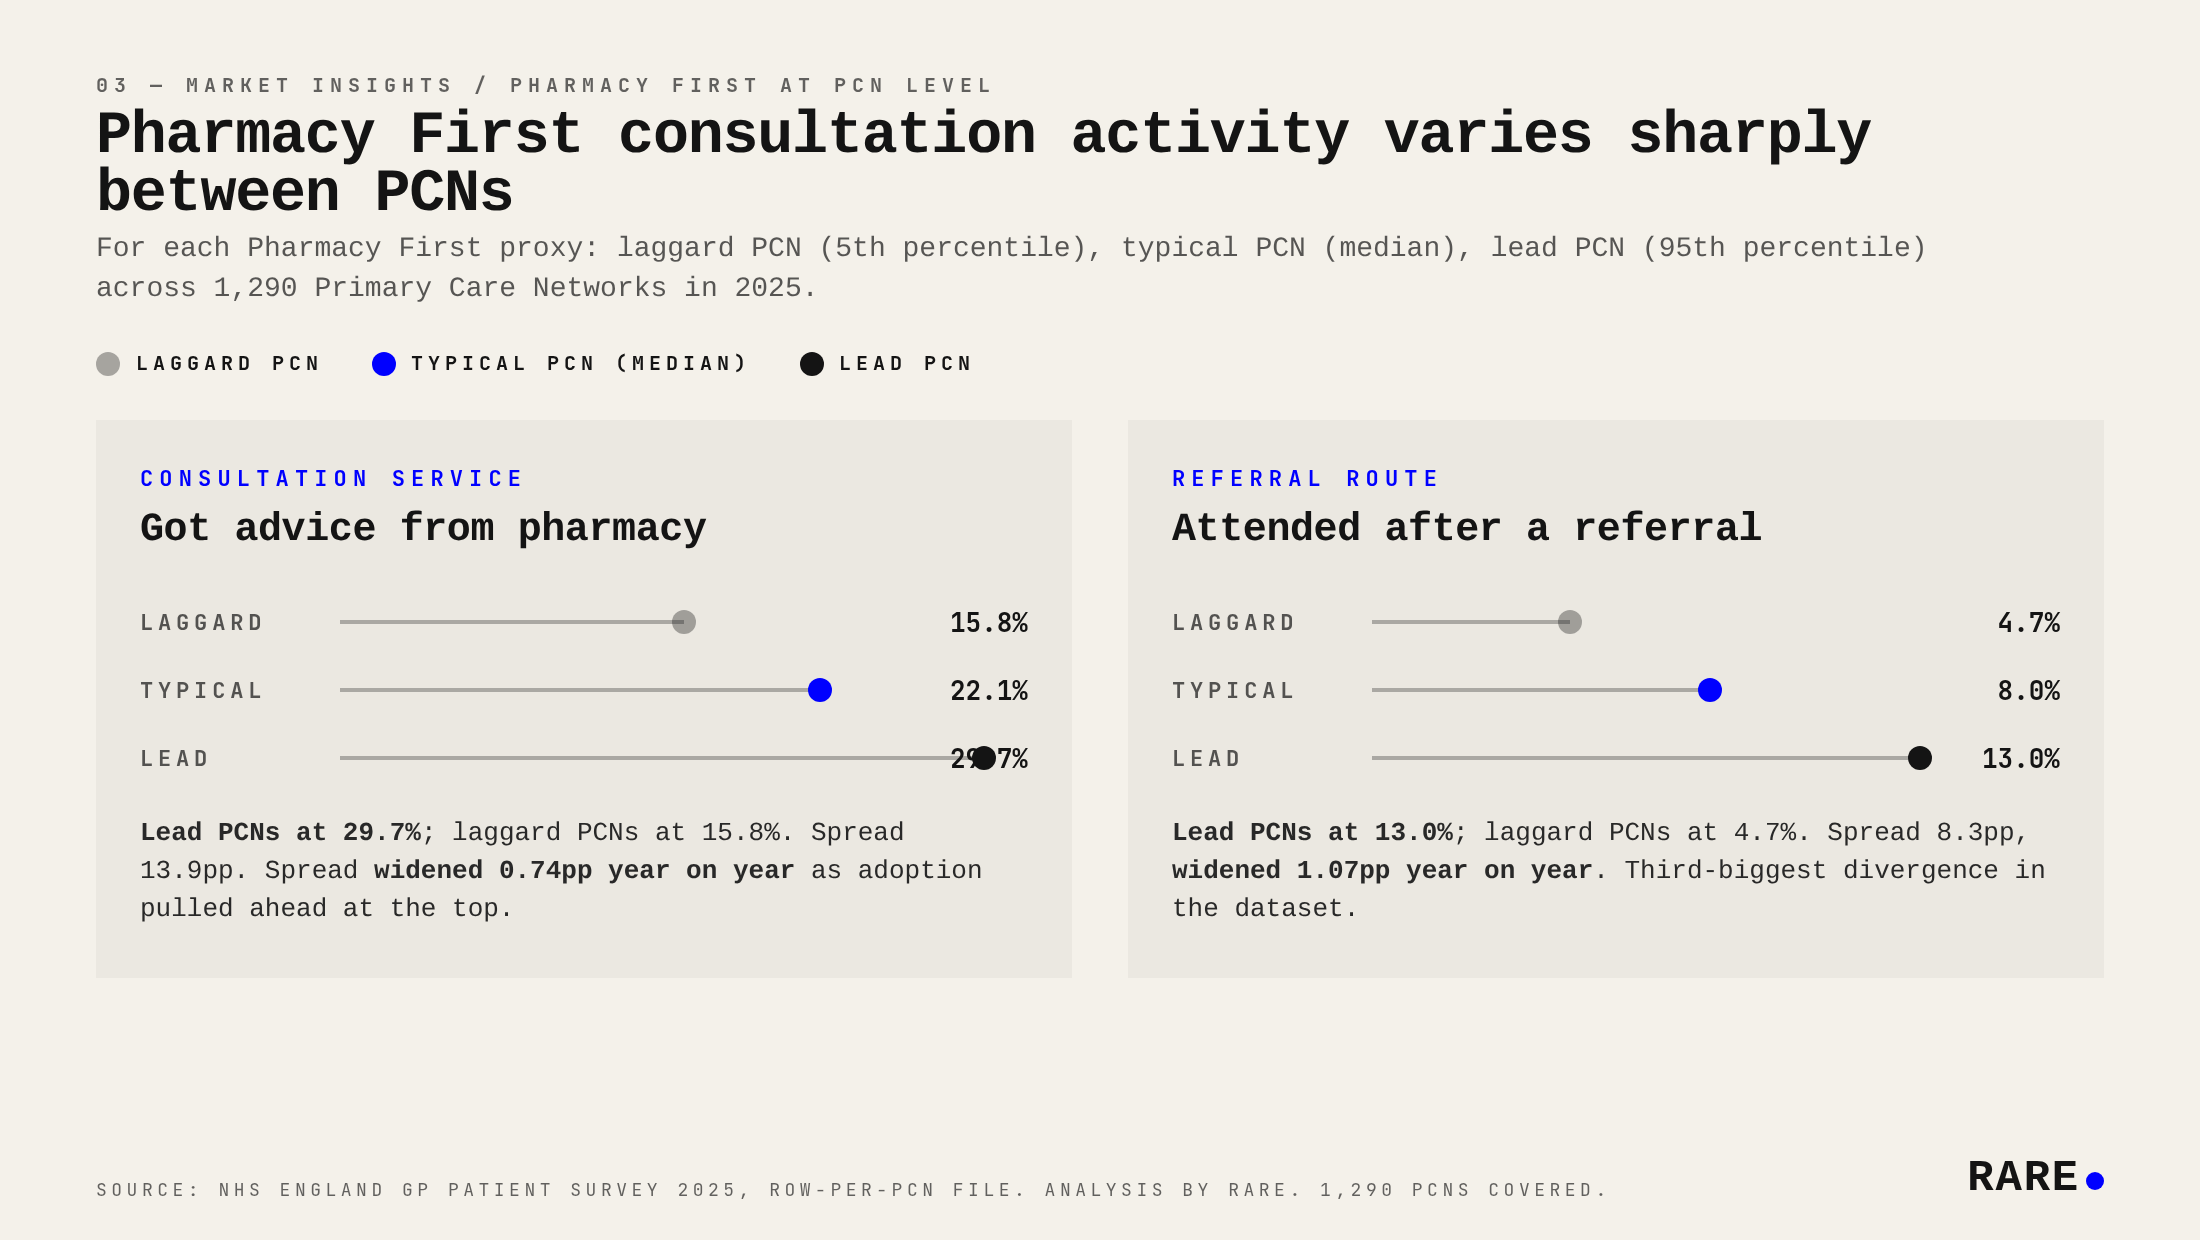
National averages and regional averages both hide a wide spread at PCN level. Across 1,290 Primary Care Networks in 2025, lead PCNs on patient-led advice-seeking are at 29.7%, laggard PCNs at 15.8%, a 13.9-percentage-point gap. On referral attendance the lead is at 13.0%, the laggard at 4.7%, an 8.3-point gap that widened 1.07pp year on year. The spread between PCNs is now several times larger than the spread between regions on these metrics.
The variation between PCNs on Pharmacy First-aligned activity is also growing. The lead-to-laggard spread on advice widened 0.74pp year on year. On referral attendance it widened 1.07pp. The rollout isn't happening uniformly across networks even within the same region. Any monitoring framework needs to look at the local picture as well as the national one.
What this means
For pharmacy operators: the implication is operational. More consultation rooms in use, more clinical staff time per interaction, fewer interactions ending in a dispensed product. The 2025 data is the first national readout that confirms the channel mix is genuinely shifting. The chain-level question is who has the floor space, staff mix and IT systems to absorb this shift. Boots and Well start from a position of scale; Lloyds's 2023 exit from community pharmacy already removed one large bidder from the market, and the independents and small multiples start from a different point. Chains and groups with the strongest footprint in the South East, London and North West are the ones currently best positioned to benefit from the consultation, GP-routed referral and clinical-services patterns visible in the 2025 data. The GP-side data points at a second operational implication: in regions where referrals flow more through 111 and A&E than the GP, the pharmacy contact is more transactional and less embedded in primary-care continuity.
For commissioners and policymakers: the early signal supports continued investment in the clinical-services model. Patient experience held up while volume grew. The regional pattern suggests local commissioning choices are now the variance driver, and a single-channel national rollout is not what is actually happening. The London GP routing rate is a useful test of whether primary-care engagement with Pharmacy First can be replicated elsewhere.
For pharma, medical-device and PE commercial teams: the trend is consistent across multiple independent metrics. It is not noise, not a single outlier moving, which makes it a more durable basis for forecasting than any individual number would be. The pharmacy channel is now material enough that 2026 plans should model it explicitly, with regional variance built in. The three regional stories are not interchangeable: South East for consultation-driven engagement, London for GP-routed referral reach, North West for physical clinical-service deployment.
The Pharmacy First rollout is reshaping community pharmacy, but it is doing so along regional lines that already existed. The commercial and policy question for the year ahead is whether the lagging regions catch up, or whether the patterns visible in 2025 harden into a structural division of labour between consultation, GP-routed referral, system-routed referral and clinical-services channels.
The 2026 GP Patient Survey results, due later this year, will be the cleanest test we have of how durable the early Pharmacy First signal really is, and whether the three regional centres of gravity remain in place or start to spread.
About the data
GP Patient Survey, 2024 and 2025 waves (Ipsos for NHS England). The community-pharmacy section is published at Primary Care Network level: 1,275 PCNs in 2024 and 1,290 in 2025, with 1,247 in common across both years. National figures cited are base-weighted means computed from the PCN-level published values. Year-on-year changes are flagged as statistically meaningful where the difference exceeds 1.96 standard errors of the difference. Regional values are base-weighted means across PCNs within each NHS commissioning region (seven regions cover England). PCN-level percentile values are computed across the full PCN population. GP-side referral data is taken from the GP-experience section of the same survey: share of patients whose last GP contact ended with them being told to go to a pharmacy. Got advice and After a referral from another service are patient-reported answers, so subject to ordinary recall and interpretation effects; structural movements should be read at the trend rather than the decimal level. Further information on Pharmacy First is available at england.nhs.uk/primary-care/pharmacy/pharmacy-services/pharmacy-first, sector context from Community Pharmacy England, and the underlying survey methodology from gp-patient.co.uk.
Analysis by Rare.