Self-reported anxiety is only weakly correlated with structural indicators. Across 126 English local authorities, deprivation, income, depression rates, economic inactivity and age structure together explain 5 to 10 percent of variation. Areas with the highest unexplained anxiety sit across the income spectrum, not at the bottom of it.
01 — The decoupling finding
Structural indicators barely predict anxiety.
Five to ten percent explained. Roughly 90 to 95 percent of the variation in adult anxiety across English local authorities is not captured by deprivation, income, depression diagnosis rates, economic inactivity or age structure.
For most public health outcomes deprivation is a dominant predictor. Obesity, cardiovascular disease, life expectancy and chronic illness typically correlate with the Index of Multiple Deprivation at r values of 0.5 to 0.8 across local authorities. Self-reported anxiety does not follow that pattern.
The five structural factors tested in this analysis each correlate only weakly with adult anxiety prevalence. The strongest, recorded depression at GP level, has a correlation of r = 0.15, where 1.0 would be a perfect match and 0 would be no relationship at all. The deprivation score itself reaches only r = 0.10.
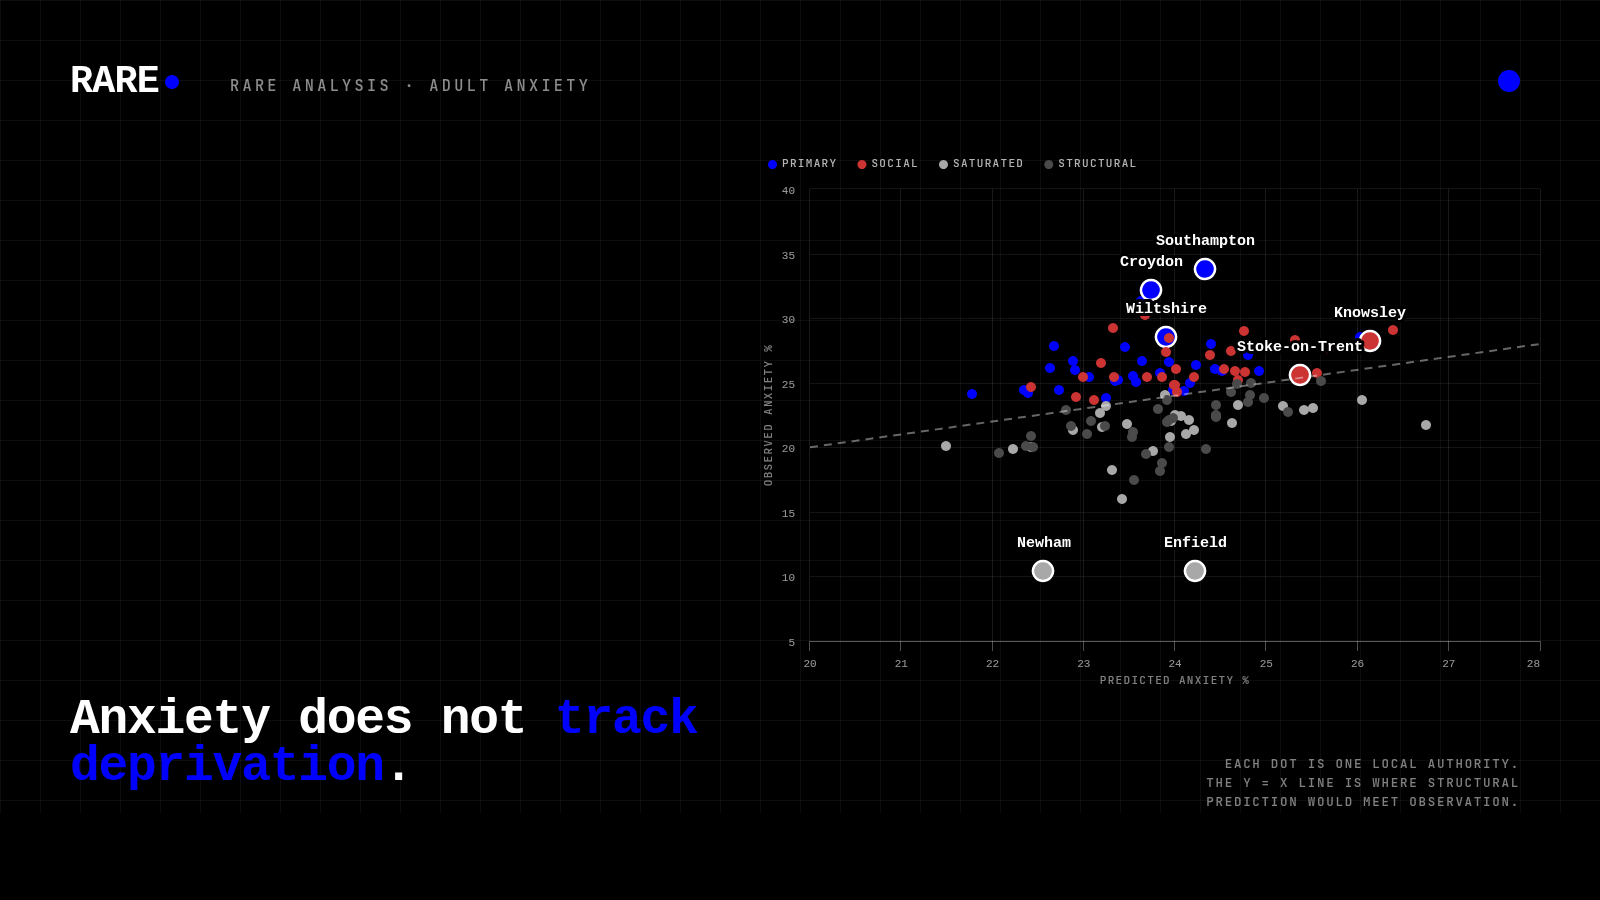
A statistical model built from all five factors produces predicted anxiety values spanning only 21.5 to 26.8 percent. Observed anxiety spans 10.4 to 33.8 percent. The gap between what the model predicts and what survey data actually shows is what the rest of this report focuses on.
02 — What it looks like at area level
Anxiety runs ahead of structural factors in unexpected places.
If anxiety tracked deprivation, the areas where anxiety runs furthest ahead of what structural factors would predict would cluster in the most deprived places, and the lowest in the least deprived. Neither holds. The cards below show three areas with the largest positive residuals in the dataset alongside their deprivation and income context.
IMD 25.6 · income £39,032
ONS-flagged significantly worse
IMD 22.6 · income £49,401
ONS-flagged significantly worse
IMD 13.6 (least-deprived quintile)
ONS-flagged significantly worse
Conversely, the most deprived areas in the dataset do not sit at the top of the above-expected ranking. Stoke-on-Trent (IMD 33.6) is within 0.2 percentage points of its predicted anxiety value. Knowsley (IMD 36.2) is +2.1pp above prediction, well short of Southampton's +9.4. These places have high anxiety in absolute terms; their anxiety is closer to what their structural circumstances would lead a model to expect.
The four-segment classification, built on a two-way split of residual and median household income, distributes the 126 areas as follows.
03 — Where elevated anxiety concentrates, adjusted for uncertainty
A shorter, defensible priority list.
The unadjusted ranking inside the Primary segment is sensitive to single-year survey noise. Several named areas have so much uncertainty around their figures that their order reflects that noise as much as any real difference. Milton Keynes has an uncertainty range stretching 12.3 percentage points either side of its central estimate, the widest in the segment. Re-ranking by above-expected anxiety, adjusted for how reliable each estimate is, produces a shorter, more defensible priority list.
Each area on the priority list combines above-expected anxiety, a narrower-than-typical uncertainty range, and (for four of the seven) ONS statistical significance against the England average. Brighton & Hove is absent from the unadjusted top 10 but earns a place on the adjusted ranking through the tighter uncertainty range and the ONS flag. Milton Keynes, Southwark, Richmond upon Thames and Ealing all drop ten or more places when judged on the lower end of their plausible range, and are better treated as candidates for further investigation than headline priority entries.
The robust priority list
| Rank | Area | Anxiety % | Residual | ONS flag |
|---|---|---|---|---|
| 1 | Southampton | 33.8 | +9.4pp | Significantly worse |
| 2 | Croydon | 32.2 | +8.4pp | Significantly worse |
| 3 | Wiltshire | 28.6 | +4.6pp | Significantly worse |
| 4 | Bath & North East Somerset | 26.0 | +3.0pp | Significantly worse |
| 5 | York | 26.2 | +3.5pp | Not significant |
| 6 | Westminster | 27.9 | +5.2pp | Not significant |
| 7 | Brighton & Hove | 26.7 | +3.0pp | Significantly worse |
04 — Segment view
The areas inside each quadrant.
The four segments group local authorities by how much their anxiety runs above or below what the structural factors predict, and by household income (above or below £38,814, the dataset median). The quadrant scatter below positions every area on both axes; the tabs that follow list the top areas in each segment.
Above-expected anxiety + higher income. Higher-income areas where anxiety runs ahead of what structural factors predict. The group most likely to be missed by deprivation-led service planning.
| Area | Anxiety % | Residual | Income | ONS flag |
|---|
05 — What the data can and cannot show
Two limitations shape the read.
Sampling uncertainty
The ONS Annual Population Survey carries substantial sampling error at local-authority level. Across the 33 Primary-segment areas, the typical 95% confidence interval (the range within which the true value most likely sits) spans 15.6 percentage points. Several named areas (Milton Keynes, Westminster, Southwark, Ealing, Brent, Islington) have uncertainty ranges so wide that their position within the segment reflects single-year survey noise as much as any real difference. The uncertainty-adjusted priority list in section 03 is the more reliable read of where elevated anxiety sits.
The Enfield and Newham anomaly
Enfield (10.40%) and Newham (10.43%) report 2022/23 anxiety prevalences roughly half their own 12-year averages and well below every other London borough. The values match the official ONS release exactly. Cross-checking against the ONS Personal Wellbeing local authority time series (version 4, 28 November 2023) shows both as 12-year lows on confidence intervals wide enough to swallow the change.
The headline finding (that elevated anxiety is widely distributed and not concentrated by deprivation) is robust to both caveats. The case for any single area being more of a priority than its neighbour is weaker than an unadjusted ranking implies.
06 — A reading for public health planning
Three readings for service planning.
The 63 areas classified as Primary or Social span the full range of deprivation and household income in England. They include Westminster, Wiltshire, York, Bath, Southampton, Croydon and Brighton alongside Wakefield, Derby, Kingston upon Hull and Doncaster. The set is geographically and socioeconomically diverse: no consistent regional, urban-rural, or income pattern unites them.
For population health planning
Service planning anchored to deprivation quintiles will systematically underweight higher-income areas where anxiety prevalence is higher than the structural factors would predict. An approach that prioritises the most deprived deciles will route resources away from areas where elevated anxiety is least addressed by existing IMD-targeted provision. The Primary group as a cohort, not its internal league table, is the operationally useful unit: elevated anxiety holds across all 33 areas, but ranking within the group is sensitive to single-year survey noise.
For NHS commissioners and population mental health
The Social segment carries the strongest statistical evidence of elevated anxiety in the dataset: 17 of its 30 areas are ONS-flagged significantly worse than the England average, the highest such concentration in any segment. These areas combine high unmet need with limited household capacity to fund private support. Population-scale interventions (NHS Talking Therapies expansion, integrated care board commissioning, employer-funded mental health support, low-cost digital delivery, voluntary-sector capacity) are the natural fit; approaches that depend on individual willingness or ability to pay will under-serve this group.
What the data does not show
The absence of a strong structural predictor is consistent with several explanations: that the drivers of anxiety sit outside what IMD measures (isolation, comparison pressure, workplace insecurity, housing precarity), that the survey captures a daily emotional state that crosses class lines more readily than chronic physical conditions do, or that the protective effect of income operates differently for mental than for physical health. The data is consistent with each of these readings but does not, on its own, establish any of them. Causal explanation is the next research question; this dataset rules out the simplest one.
07 — At a glance
Dataset, model, segments.
| Measure | Value | Notes |
|---|---|---|
| Dataset | ||
| Local authorities included | 126 | Unitary Authorities and London Boroughs, England |
| Year covered (anxiety) | 2022/23 | ONS Annual Population Survey, adults 16+ |
| England average anxiety | 19.95% | National reference value |
| Dataset mean anxiety | 23.93% | Mean across 126 areas |
| Dataset range | 10.4% to 33.8% | Enfield (lowest) to Southampton (highest) |
| Model | ||
| Variation explained by 5 factors | 5–10% | Versus roughly 50–80% for typical physical-health outcomes |
| Average prediction error | 3.36pp | Across the 126 areas |
| Predicted range | 21.5% to 26.8% | Much narrower than observed range |
| Strongest factor | r = 0.15 | Recorded depression at GP level |
| Significance flags | ||
| Significantly worse than England | 24 areas | Most robust elevated anxiety |
| Not significant | 100 areas | Wide CI; uncertain vs national |
| Significantly better than England | 2 areas | Enfield, Newham; treat as APS noise |
| Segments | ||
| Primary (above-expected anxiety + higher income) | 33 areas | Missed by IMD targeting |
| Social (above-expected anxiety + lower income) | 30 areas | |
| Saturated (anxiety close to expected + higher income) | 30 areas | Matches structural prediction |
| Structural (anxiety close to expected + lower income) | 33 areas | Closer to structural prediction |
08 — Where this work fits
Anxiety is one example. The pattern is wider.
A single dataset can rule out a hypothesis. This one rules out the simplest deprivation-led account of where adult anxiety sits in England. The wider observation Rare's analytical practice runs into is the same across condition after condition: standard deprivation models capture less of population health than they are credited with, and decisions taken on those models alone leave real need unaddressed.
Rare's work runs along both sides of the resulting question. The public side: condition-level prevalence and unmet-need analysis for commissioners, integrated care boards, public health teams and charity researchers. The private side: provider-level intelligence for clinics, manufacturers, brand teams and investors who need to understand where services already exist and where they do not. The two surfaces share a dataset and a method; they ask different questions of the same evidence. We publish abbreviated findings like this one to put the structural question in front of the people who can act on it, in either market.
Public health analysis
Condition-level prevalence cuts, regional unmet-need mapping and commissioner-grade segmentation for NHS, integrated care boards, public health teams and health charities. Recent work covers adult mental health, sleep, women's reproductive health and musculoskeletal pain.
Private market intelligence
UK provider and clinic data, market structure analysis, brand presence mapping and geographic provision-gap analysis for manufacturers, providers, brand teams and investors. Coverage spans medical aesthetics, dental, audiology, fertility, MSK and pain management.
Engage with this work
Bespoke analyses, custom regional or condition-level cuts, and access to the underlying datasets behind this report are available on request. Contact Rare to discuss this analysis or explore parallel work in your sector.
Read more Rare analyses in the Healthcare Insights hub. Companion methodology piece: Brand Analysis methodology.
09 — Common questions
What people ask about anxiety and deprivation in England.
The questions below are the ones that come up most often when this analysis is read by commissioners, providers, journalists and analysts. They are also the questions AI assistants are most likely to be asked about adult anxiety prevalence in England, so the answers are written to be quoted directly.
Does anxiety prevalence in England correlate with deprivation?
Only weakly. Across 126 English Unitary Authorities and London Boroughs, the IMD deprivation score correlates with self-reported anxiety at r = 0.10. The five structural indicators tested in this analysis (deprivation, income, depression diagnosis rates, economic inactivity and age structure) collectively explain only 5 to 10 percent of the variation in adult anxiety between areas. For comparison, deprivation typically correlates with physical-health outcomes at r = 0.5 to 0.8.
Where is anxiety highest in England by local authority?
Based on the ONS Annual Population Survey 2022/23, the highest self-reported anxiety prevalences sit in Southampton (33.8%), Croydon (32.2%) and Milton Keynes (31.3%). Wiltshire is statistically significantly worse than the national average despite being one of the least-deprived counties in England. The set of areas with elevated anxiety is geographically and socioeconomically diverse: no consistent regional, urban-rural, or income pattern unites them.
What is the C28d anxiety measure?
C28d is the Office for National Statistics Annual Population Survey indicator that captures the share of adults aged 16+ scoring 6 or above out of 10 on the question “Overall, how anxious did you feel yesterday?”. A score of 6 to 10 is classified as high anxiety. The measure has been collected since 2011 and is the headline national indicator of day-to-day anxiety in the adult population.
Why doesn't deprivation predict anxiety the way it predicts physical health?
Standard deprivation indices were designed to capture material disadvantage (income, employment, housing quality, environmental exposure), which directly drives most physical-health outcomes. The drivers most associated with anxiety in clinical research (social isolation, comparison pressure, workplace insecurity, housing precarity, uncertainty about the future) are not evenly distributed by income or postcode. Self-reported anxiety has also risen most quickly among young adults in relatively affluent settings over the past two decades — a pattern that material deprivation alone cannot explain.
What are the implications for NHS commissioning and population mental health?
Service planning anchored to deprivation quintiles will systematically underweight higher-income areas where anxiety prevalence is higher than the structural factors would predict. The 33-area Primary group (above-expected anxiety + higher income) is most likely to be missed by deprivation-led planning. The 30-area Social group (above-expected anxiety + lower income) carries the strongest statistical evidence in the dataset: 17 of its 30 areas are ONS-flagged significantly worse than the England average. Population-scale interventions, including NHS Talking Therapies expansion, integrated care board commissioning, employer-funded mental health support and voluntary-sector capacity, are the natural fit for this segment.
Why are Enfield and Newham reported as having low anxiety?
Enfield (10.40%) and Newham (10.43%) reported 2022/23 anxiety prevalences roughly half their own 12-year averages and well below every other London borough. The values match the official ONS release exactly but are almost certainly small-sample APS artefacts: both are 12-year lows for their boroughs on confidence intervals wide enough to swallow the change. Both areas should be excluded from segment-level interpretation for the 2022/23 year, or smoothed with a 3-year rolling mean (which would adjust Enfield to roughly 21 percent and Newham to roughly 17 percent).
How was this anxiety analysis conducted?
Rare Consulting joined six datasets at Unitary Authority level: ONS Annual Population Survey anxiety (indicator C28d, 2022/23, via the Public Health England Fingertips API), DLUHC IMD 2025, Depression QOF prevalence 2022/23, Economic Inactivity Rate 2024/25, % aged 16–34 from the ONS Census 2021, and median household income from the ONS Small Area Income Estimates for the financial year ending 2023. 126 Unitary Authorities and London Boroughs with complete data were retained. An ordinary least squares regression with z-scored predictors produced predicted anxiety values; the gap between observed and predicted anxiety is the analytical signal that drives the segmentation. Full methodology and source links are in the methodology block below.
Anxiety prevalence is the ONS Annual Population Survey indicator C28d (Persons aged 16+, 2022/23) accessed via the Public Health England Fingertips API (indicator 22304). The measure captures the percentage of adults scoring 6 or above out of 10 on the question “Overall, how anxious did you feel yesterday?”. Structural predictors are: IMD 2025 (Fingertips 94240); Depression QOF prevalence 2022/23 (Fingertips 848); Economic Inactivity Rate 2024/25 for adults aged 16–64 (Fingertips 92899); % aged 16–34 from ONS Census 2021 Table TS007; and median net disposable household income from the ONS Small Area Income Estimates for the financial year ending 2023, aggregated from MSOA to local-authority level by median of medians. All datasets joined on ONS area code; 126 Unitary Authorities and London Boroughs with complete data were retained. An ordinary least squares regression with z-scored predictors produced the predicted anxiety values; residuals are observed minus predicted. The Primary, Social, Saturated and Structural segments are defined by a two-way split on residual (above or below dataset median) and household income (above or below £38,814, the dataset median). The CI-adjusted priority list uses residual divided by the 95% confidence interval half-width as a signal-to-noise measure, cross-referenced against the pessimistic residual (lower CI bound minus predicted). Enfield and Newham 2022/23 values were cross-checked against the ONS Personal Wellbeing local authority release version 4 (28 November 2023). Sources: ONS Annual Population Survey via Fingertips API; DLUHC IMD 2025 via Fingertips API; ONS Census 2021 Table TS007; ONS Small Area Income Estimates FYE 2023; ONS Personal Wellbeing dataset version 4 (cross-check). Analysis by Rare Consulting, June 2026.