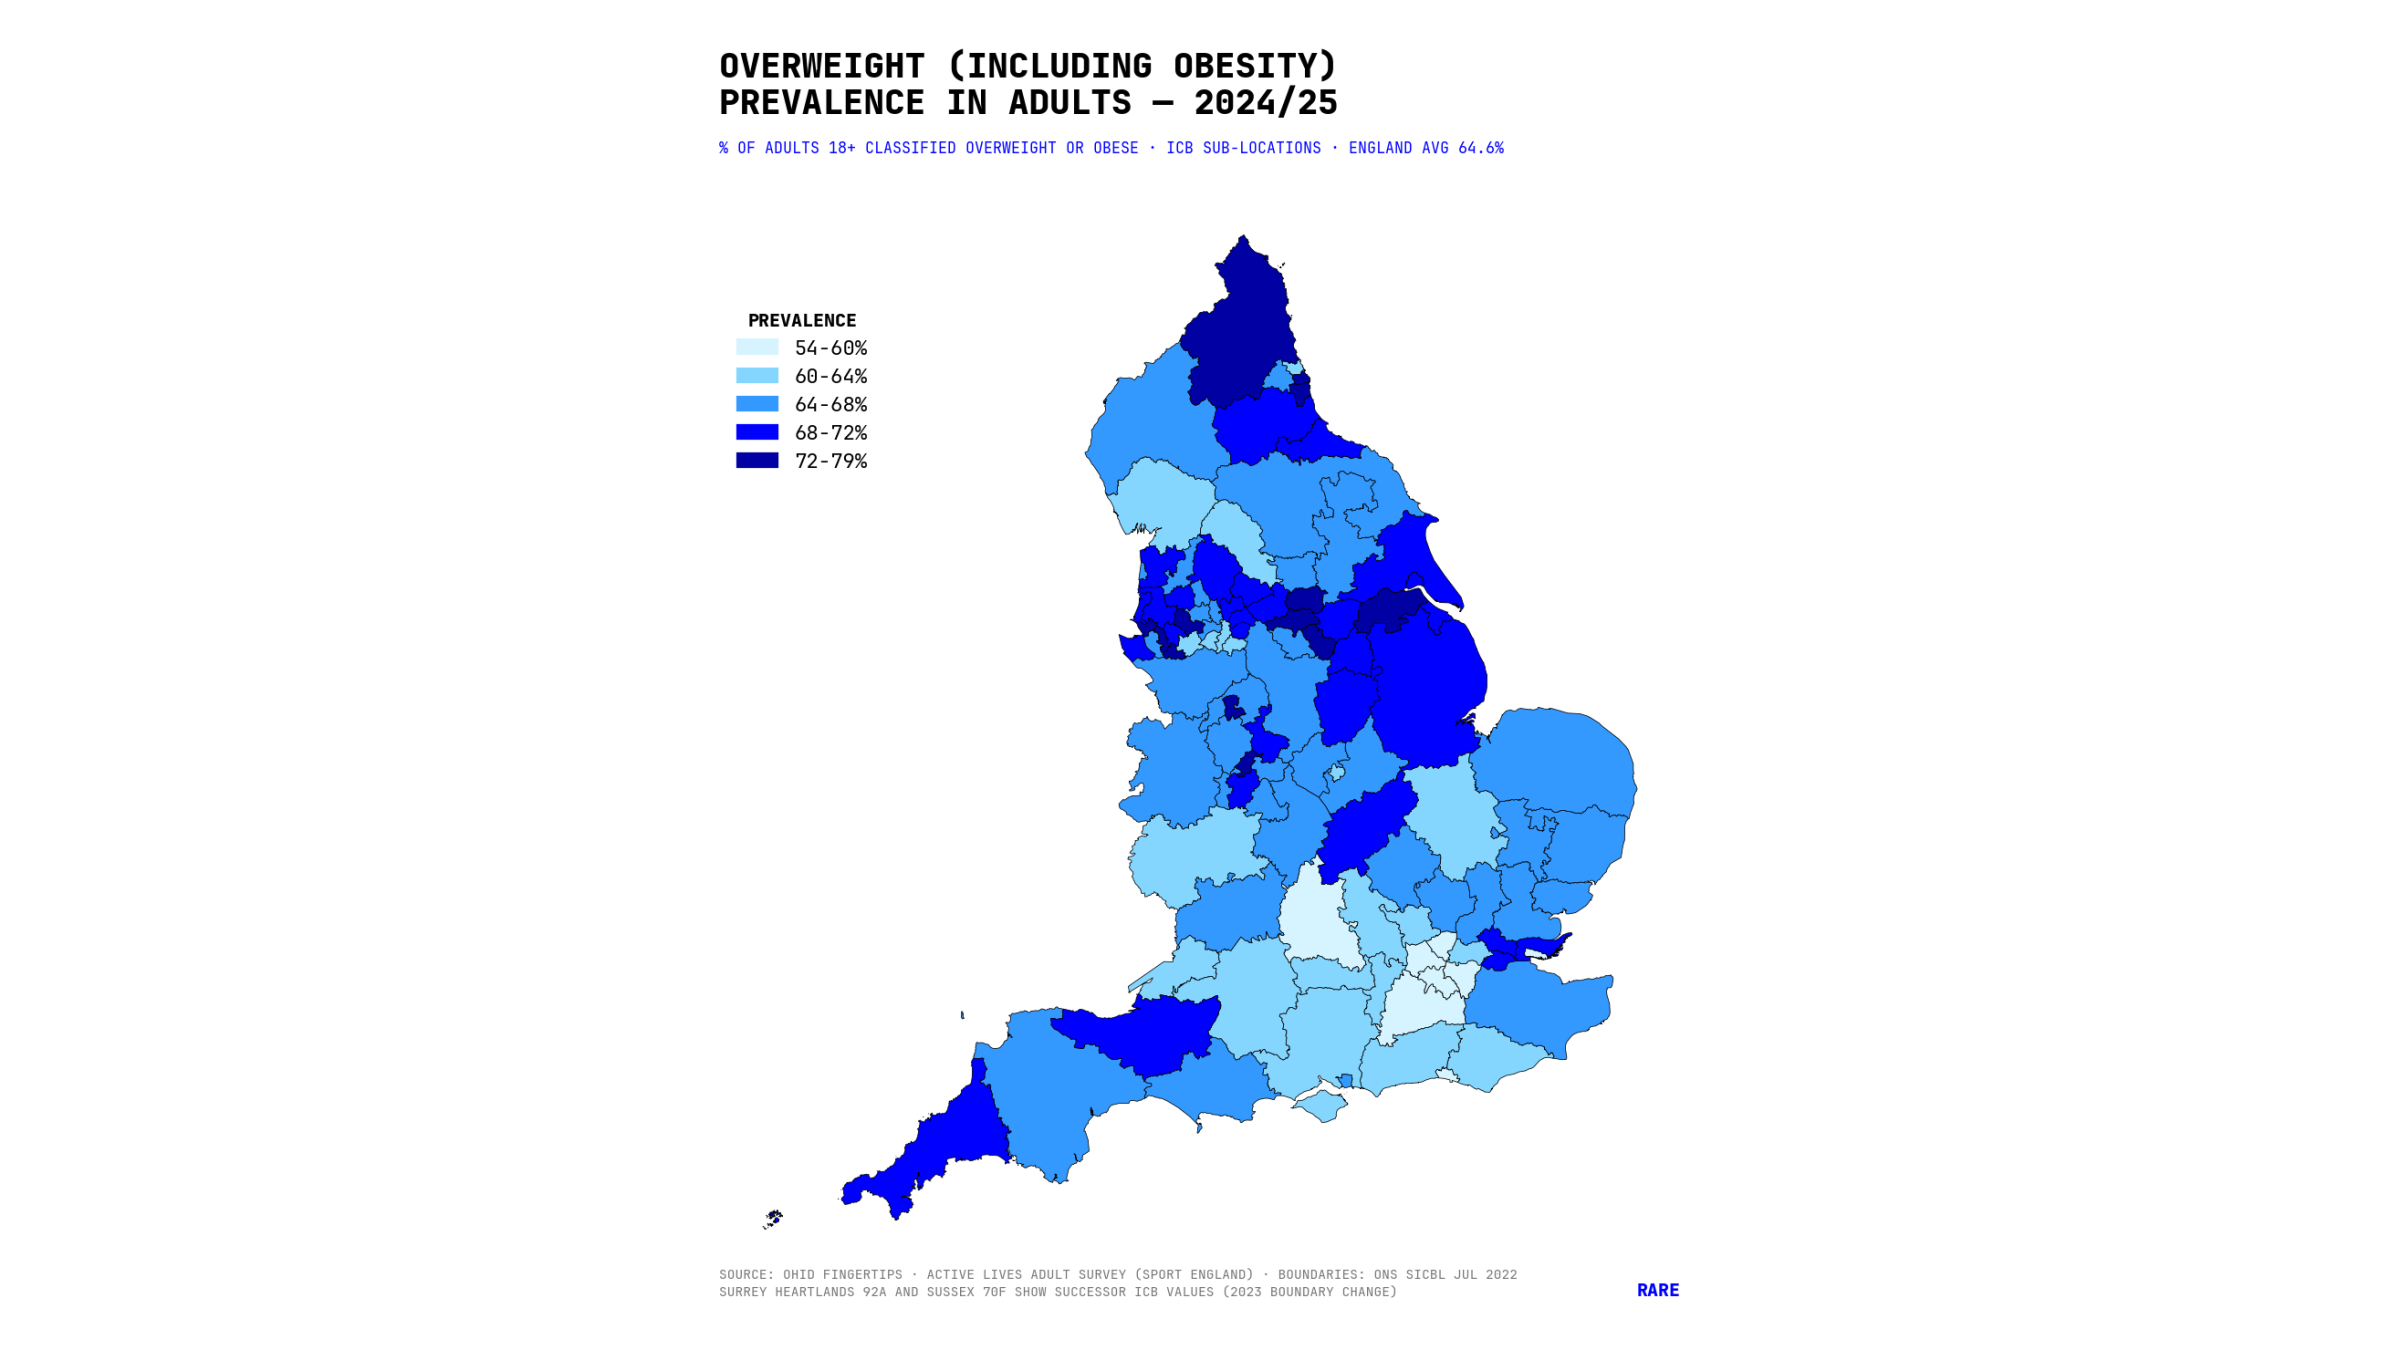
Adult obesity and overweight prevalence in England reaches 64.6% in 2024/25, according to the latest OHID Fingertips release. Beneath the national average sits a 25-point gap between the lowest and highest Sub-ICB Locations, with the highest rates clustered in the Midlands and the North, the same week the MHRA approves the UK’s first oral GLP-1 tablet.
Nearly two in three adults in England, 64.6%, are now classified as overweight or obese, according to the latest Active Lives Adult Survey (ALAS) estimates published through OHID’s Fingertips platform. The figure has risen steadily from 61.2% in 2015/16, and the new 2024/25 data shows no sign of the trend reversing.
Against this national picture, the MHRA has approved the UK’s first GLP-1 tablet for weight loss, an oral form of Wegovy (semaglutide) for adults with a BMI of 30 or above, or 27 to 30 with a weight-related health condition. On these prevalence figures, a substantial share of England’s adult population could meet the eligibility threshold.
A clear geographic divide
Beneath the national average sits a striking spread. Across the 104 Sub-ICB Locations with published 2024/25 data, obesity and overweight prevalence ranges from 54.4% to 79.0%, a gap of almost 25 percentage points between the lowest and highest areas.
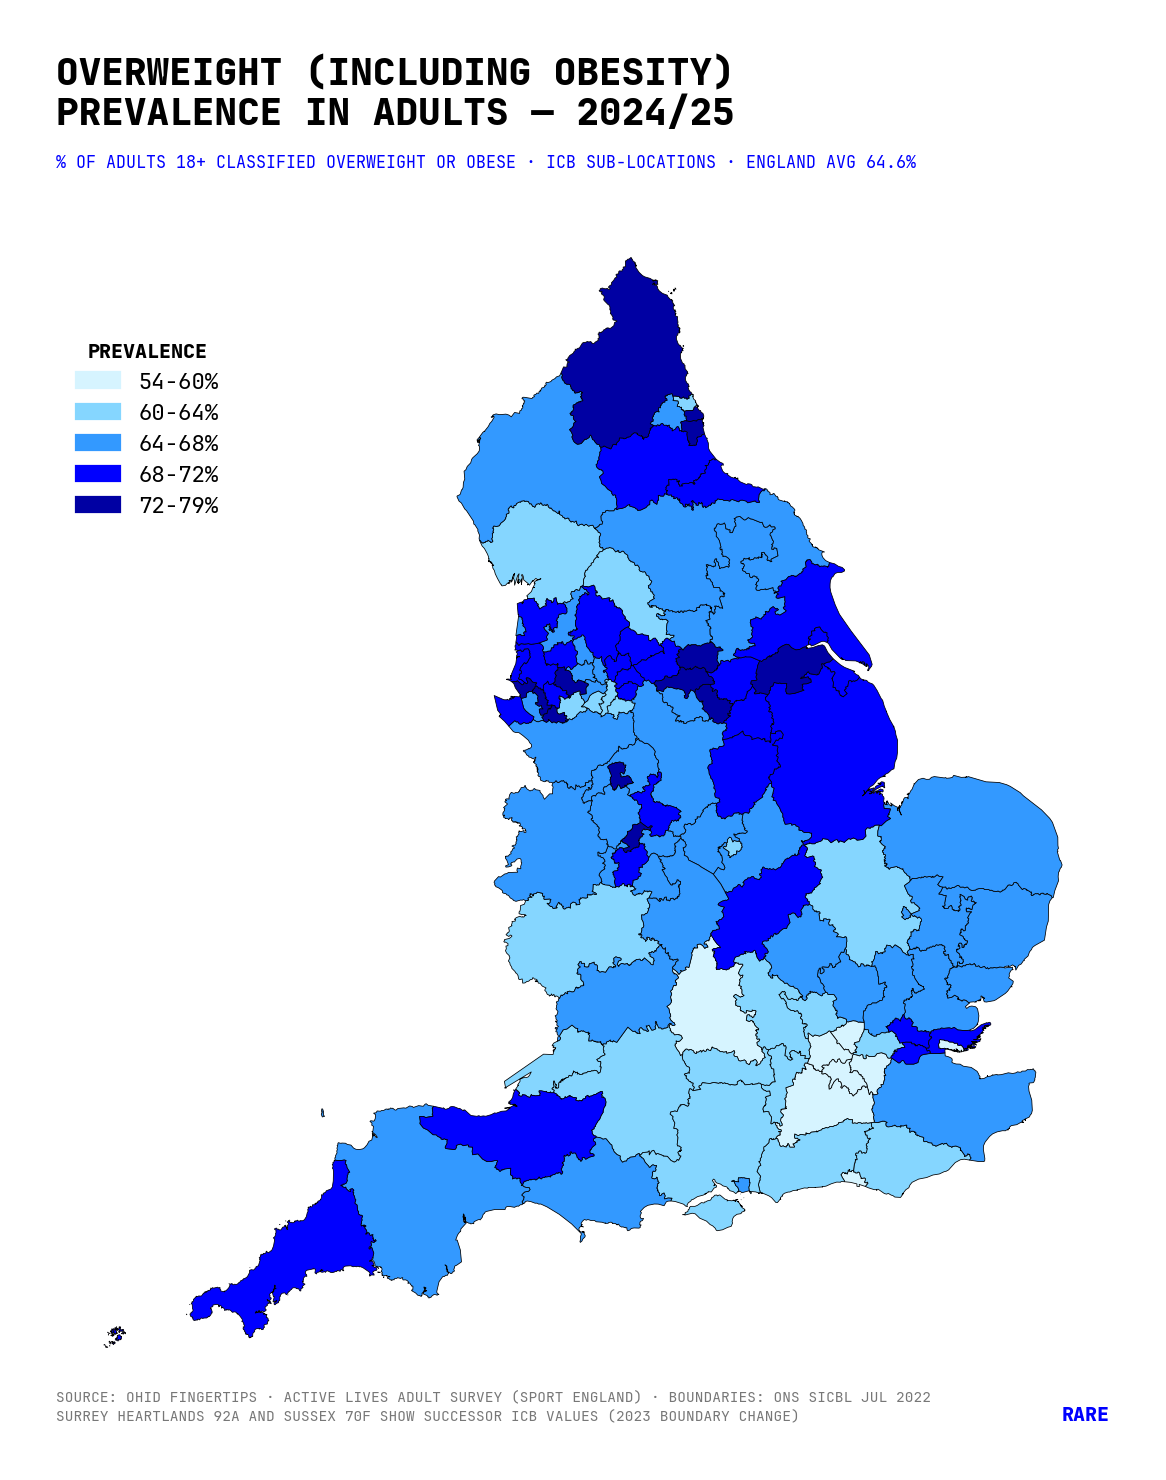
The pattern is unmistakably north to south, with London as the standout exception. The five lowest-prevalence Sub-ICB Locations are all in London or the South East: North Central London (54.4%), the Sussex 09D Sub-ICB Location (55.2%), North West London W2U3Z (56.0%), South West London 36L (56.5%) and Mid and South Essex 99G (58.2%).
At the other end, the highest rates cluster in the Midlands and the North: Staffordshire and Stoke-on-Trent 04Y tops the table at 79.0%, followed by North East and North Cumbria 00P (77.0%), Cheshire and Merseyside 01J (74.6%), another North East and North Cumbria Sub-ICB Location (74.4%) and South Yorkshire 02P (74.4%).
Most areas sit above the national benchmark
When benchmarked against England, 48 of the 104 Sub-ICB Locations are statistically worse than the national value, 41 are similar and only 15 are better. The median Sub-ICB Location sits at 67.3%, well above the England figure of 64.6%. The median above the mean reflects how the lower-prevalence London populations pull the national average down.
Read single-year shifts cautiously
Comparing 2024/25 with 2023/24, the largest increases were in Cheshire and Merseyside 01T (+8.3 points), Staffordshire and Stoke-on-Trent 04Y (+7.1) and Cornwall and the Isles of Scilly (+7.1). The largest falls were in Mid and South Essex 99G (−8.9), Cheshire and Merseyside 02E (−8.2) and North East and North Cumbria 99C (−6.5).
Treat single-year swings of this size at Sub-ICB Location level with caution. 95% confidence intervals around these survey-based estimates are typically ±2 to ±4 percentage points at this geography, so much of the movement above may reflect sampling variation rather than genuine change.
A shifting treatment landscape
The MHRA’s 11 June 2026 approval makes the UK the third country to authorise the oral GLP-1 tablet, after the US and the United Arab Emirates, and the first in Europe (The Guardian, 11 June 2026).
Doses escalate from 1.5mg once daily through 4mg and 9mg to a 25mg daily maintenance tablet, with a minimum of one month at each level. Patients already on the 2.4mg weekly semaglutide injection can transition straight to 25mg tablets once daily. Clinical trials reported patients on the highest dose losing 14 to 17% of their body weight after 64 weeks (MHRA press release, gov.uk; The Guardian).
Access is private only for now. The tablet is licensed in the UK but is not yet on the NHS; eligible patients will need a private prescription until NICE completes its evaluation. Wegovy injections currently run roughly £90 to £300 a month on private prescription, depending on the dose, and Chemist4U estimates around 2.5 million people in the UK are already using weight-loss injections (The Guardian, 11 June 2026). For patients uncomfortable with self-injection, the tablet widens the access route rather than the eligibility one.
Set against the map above, the eligibility criteria are striking. Roughly two-thirds of adults nationally already sit above the BMI 25 threshold, and Sub-ICB Locations in the Midlands and the North reach as high as 79%. The populations the eligibility criteria will land on hardest sit in the same areas where weight-related disease burden is already most concentrated.
Eligibility and access are not the same thing
On the BMI criteria alone, the population eligible for the new tablet runs to many millions of UK adults. None of them can get it on the NHS today. Until NICE completes its evaluation, the tablet is available only on private prescription.
Treatment is also only one lever. The Obesity Health Alliance, marking the same approval, noted that “no medicine can fix a food system that leaves too many families surrounded by cheap, heavily marketed, less healthy food”, and that 65 health organisations have written to the chancellor urging protection of evidence-based diet policies (The Guardian).
Methodology: Estimates are age-standardised percentages of adults aged 18+ with a BMI of 25kg/m² or above, derived from self-reported height and weight in Sport England’s Active Lives Adult Survey (ALAS), adjusted to approximate measured values. Boundaries shown are ONS Sub-ICB Locations (July 2022). Surrey Heartlands (92A) and Sussex (70F) were reorganised in the 2023 boundary change and have no directly published 2024/25 value; the map applies the successor ICB-level values to these areas, mirroring OHID’s own treatment of predecessor geographies. Low values are good for this indicator. Source: Office for Health Improvement and Disparities, Fingertips, indicator 93088. Data extracted June 2026.