
01
More people got seen, and fewer people tried
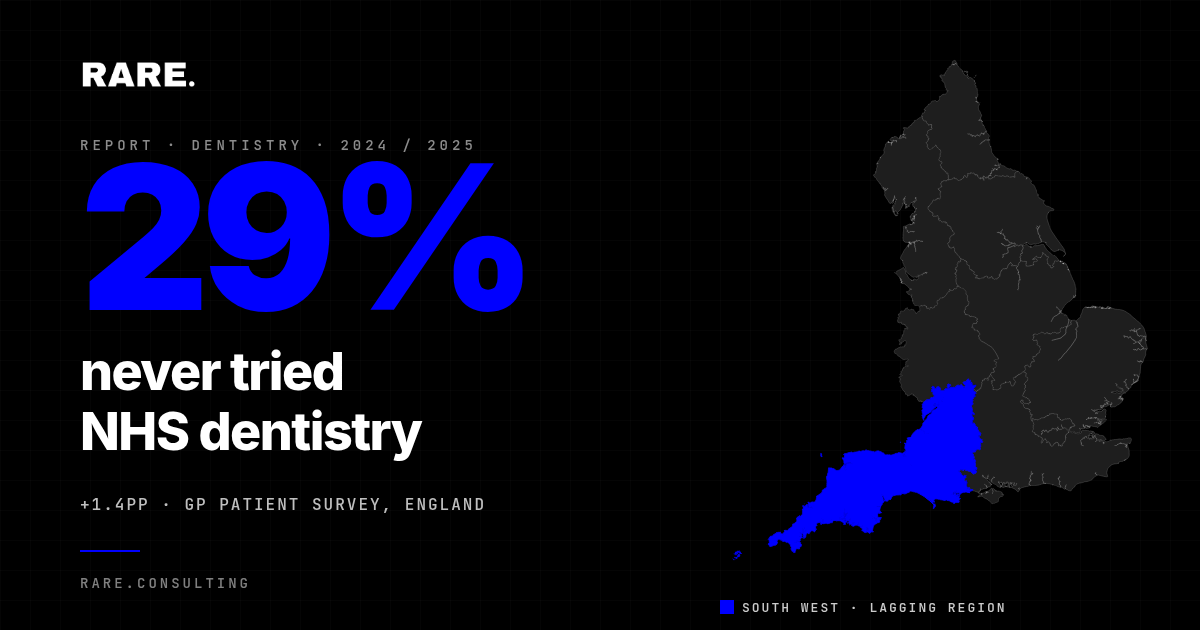
Have never tried NHS dentistry
29.0%
↑ +1.4pp on 2024
NHS dentistry improved in 2025, and the improvement reached only the people already inside the system. Of the adults who tried to get an appointment, 78.1% succeeded, up from 76.3% the year before, on Rare.Monitor's read of the GP Patient Survey. For anyone paying, it remains the lower-cost route to a dentist, provided a practice nearby still takes NHS patients.
More of them rated the care positively: 70.8% rated overall experience "good", up from 69.1%. All three recorded reasons for being turned away fell: no appointments available to 8.7%, not taking new patients to 10.5%, and another reason to 5.4%.
Against that, the share who had never tried to get an NHS dental appointment at all grew by 1.4 percentage points, to 29.0%, a statistically significant move against what commissioners want. These are not people who tried and went private; they never approached NHS dentistry in the first place, and there are more of them than a year ago.
Over the same year, fewer adults tried at all: 51.2% had tried in the last two years, against 52.4%. "Good" throughout this report combines the "very good" and "fairly good" options.
Of the five national measures in this section, two moved in the direction commissioners want and three moved against it. All five changes are statistically significant. Later sections show which Integrated Care System (ICS) and Primary Care Network (PCN) areas account for each of them. Rare.Monitor's read of the same survey on community pharmacy covers the other primary-care findings.
More adults rated NHS dentistry "good"; fewer tried to get an appointment
Show data table
| Category | 2024 | 2025 |
|---|---|---|
| Tried NHS dentistry (last 2 yrs) | 52.4 | 51.2 |
| Never tried NHS dentistry | 27.6 | 29 |
| "Didn't think could get NHS appointment" | 24.7 | 26.1 |
| Tried and got an appointment | 76.3 | 78.1 |
| Rated overall experience "good" | 69.1 | 70.8 |
Two measures improved: the share of adults who tried for an NHS dental appointment and got one rose to 78.1%, and the share rating their overall experience "good" rose to 70.8%. Three moved the other way: fewer adults tried in the last two years, more had never tried, and more gave "didn't think could get NHS appointment" as their reason. Every change shown is statistically significant. Source: GP Patient Survey 2024 to 2025, national % of respondents. Bases differ: all adults (first two bars), adults who had not tried (third), adults who tried (fourth), respondents answering the overall-experience question (fifth). See methodology.
The share of adults who have never tried NHS dentistry rose 1.4pp to 29.0%, a statistically significant rise. For commissioners, that is the number to carry into the 2026 wave. It grew in the same year that adults who did get an NHS dental appointment rated the experience more highly than in 2024.
02
Ratings moved at the two ends of the five-point scale, not the middle
Among adults who had an NHS dental appointment in 2025, the change was concentrated at the two ends of the rating scale. The share rating the appointment "very good" rose 1.4 percentage points to 42.0%, and the share calling it "very poor" fell 1.3 points to 11.5%, the largest fall of any of the five rating options.
Rated the appointment "very good"
42.0%
↑ +1.4pp
Rated the appointment "very poor"
11.5%
↓ -1.3pp
The largest fall of any of the five rating options
Rated the appointment "fairly good"
28.8%
→ +0.2pp
Not statistically significant
Would return to the same practice
84.0%
↓ -0.4pp
The "fairly good" middle barely shifted, up 0.2 percentage points to 28.8% and not statistically significant. The movement was all at the ends, 1.4 points onto "very good" and 1.3 points off "very poor": people formed a firmer view than the year before, and more often a positive one. The fall in the "very poor" share held across all seven English commissioning regions, so it looks like a genuine shift rather than one area's quirk.
One measure moved the other way: the share who said they would return to the same practice slipped 0.4 percentage points to 84.0%, and the share answering "I can't remember" to that question rose 0.3 points to 4.6%. Both moves are statistically significant, and at 0.4pp and 0.3pp both are small enough to watch rather than read too much into.
The South West is lowest on "very good" and highest on "very poor"
Show data table
| Category | Rated "very good" | Rated "very poor" |
|---|---|---|
| East of England | 42.3 | 12.8 |
| London | 40.3 | 7.2 |
| Midlands | 43.2 | 9.5 |
| NE & Yorkshire | 43.8 | 12.8 |
| North West | 44.4 | 11.3 |
| South East | 41.6 | 11.2 |
| South West | 35.5 | 20.2 |
In the South West, 35.5% rated their most recent NHS dental appointment "very good", the lowest of the seven regions, and 20.2% rated it "very poor", the highest. London's "very poor" share is 7.2%, a difference of 13.0 percentage points. Source: GP Patient Survey 2025, % of respondents rating their most recent NHS dental appointment, by NHS commissioning region
In the South West, 20.2% rated their most recent NHS dental appointment "very poor", against 7.2% in London, a gap of 13.0pp. That is the widest gap between any two regions on this measure, and the South West is the only region above one in six. The next highest, the East of England and the North East and Yorkshire, are both at 12.8%.
03
Fewer adults who tried were turned away, on all three recorded reasons
Tried for an NHS dental appointment and got one, 2025
78.1%
↑ +1.8pp on 2024
Per Rare.Monitor's read of the GP Patient Survey, 78.1% of adults who tried to get an NHS dental appointment got one in 2025, up from 76.3% in 2024, a rise of 1.8 percentage points. The survey records three reasons for not getting one, and all three fell: no appointments available, the practice not taking new patients, and another reason.
"No, no appointments available"
8.7%
↓ -0.8pp
"No, not taking new patients"
10.5%
↓ -0.6pp
"No, another reason"
5.4%
↓ -0.5pp
Two things happened in 2025. Among adults who tried to get an NHS dental appointment, more got one: 78.1%, up 1.8pp. Among all adults, fewer tried at all: 51.2% had tried in the last two years, down 1.2pp. Section 4 covers the reasons adults gave for not trying.
04
Doubt about access grew; preference for private did not
When asked why they had not tried NHS dentistry in the last two years, adults gave two leading answers. Just over a quarter, 26.7%, chose "prefer to see a private dentist". A similar share, 26.1%, chose "didn't think could get NHS appointment". The first held flat, down 0.1pp. The second rose from 24.7%, the largest increase of any reason on the list.
"Didn't think could get NHS appointment"
26.1%
↑ +1.4pp
The largest move of any reason
"Prefer to see a private dentist"
26.7%
→ -0.1pp
Not statistically significant
"Haven't needed to visit"
18.8%
↓ -1.0pp
"NHS dental care too expensive"
5.6%
→ -0.1pp
Not statistically significant
"Don't like going to the dentist"
5.2%
↓ -0.4pp
"On a waiting list"
4.0%
↑ +0.3pp
The share choosing "on a waiting list" as their reason rose 0.3 percentage points nationally to 4.0%, a small but statistically significant increase. Five ICS areas moved much further than that. Humber and North Yorkshire and Lincolnshire were both up 2.2 points, Lancashire and South Cumbria 1.8, Cornwall and the Isles of Scilly 1.6, and Northamptonshire 1.3. The table below lists those five in order.
"Didn't think could get NHS appointment" rose; "prefer to see a private dentist" did not
Show data table
| Category | 2024 | 2025 |
|---|---|---|
| "Didn't think could get NHS appointment" | 24.7 | 26.1 |
| "Prefer to see a private dentist" | 26.8 | 26.7 |
| "Haven't needed to visit" | 19.7 | 18.8 |
| "NHS dental care too expensive" | 5.7 | 5.6 |
| "Don't like going to the dentist" | 5.6 | 5.2 |
| "On a waiting list" | 3.7 | 4 |
The share choosing "didn't think could get NHS appointment" rose 1.4 percentage points, more than any other reason. "Prefer to see a private dentist" was flat, down 0.1pp and not statistically significant. Source: GP Patient Survey 2024 to 2025, reasons given by respondents who had not tried NHS dentistry in the last two years, national %. Respondents may choose more than one reason. A seventh option, "another reason", was chosen by 13.7% in 2025 and is not shown.
The share choosing "didn't think could get NHS appointment" rose 1.4pp, while the three reasons the survey records for actually being turned away all fell. That second number matters, because it moved in the opposite direction to what was happening: in the same year that this doubt grew, 78.1% of the adults who did try got an appointment.
The GP Patient Survey measures belief, not availability: the 1.4pp rise records what adults thought they could get, not whether appointments were genuinely harder to come by. Success among adults who did try rose 1.8pp over the same year, so belief moved against the facts. That points at communication rather than supply: NHS England's guidance sets out what patients are entitled to and how to find an NHS dentist, and the NHS practice finder lists which practices are taking new patients. For commissioners the signal is a perception gap: adults who assume the door is shut never reach the NHS practice finder that would tell them otherwise.
05
One region is failing on the key measures, and the gap is widening
Per Rare.Monitor's read of the GP Patient Survey, the South West ranks last of the seven regions in 2025 on all four dental measures the survey reports by region: the share rating overall experience "good", the share who tried and got an appointment, the share rating their appointment "very poor", and the share choosing "didn't think could get NHS appointment".
It has the lowest share rating overall experience "good" at 60.7%, 12.5pp behind the Midlands, and the lowest share getting an appointment at 66.3%, 15.1pp behind London's 81.4%. It also has the highest share rating their appointment "very poor", at 20.2%, and the highest share choosing "didn't think could get NHS appointment", at 31.3%.
The gap between the South West and the best-performing region widened on all three of the measures where both years are comparable. On the share who got an appointment it moved from 14.1 to 15.1pp. On the share rating overall experience "good" it moved from 11.7 to 12.5pp. On the share rating their appointment "very poor" it moved from 12.4 to 13.0pp. Devon, Cornwall, Dorset and Somerset are the ICS areas inside the South West to watch most closely.
The South West sits below the other six regions on ratings and on getting an appointment
Show data table
| Category | Rated overall experience "good" | Tried and got an appointment |
|---|---|---|
| East of England | 70.2 | 77.2 |
| London | 72.6 | 81.4 |
| Midlands | 73.2 | 80.7 |
| NE & Yorkshire | 70.7 | 77.6 |
| North West | 72.2 | 79.1 |
| South East | 70.9 | 79.1 |
| South West | 60.7 | 66.3 |
Six regions sit between 70.2% and 73.2% on the share rating overall experience "good", and between 77.2% and 81.4% on the share who tried for an appointment and got one. The South West sits below all six on both, at 60.7% and 66.3%. Source: GP Patient Survey 2025, % of respondents by NHS commissioning region. Bases differ by series: respondents answering the overall-experience question, and adults who tried to get an NHS dental appointment in the last two years. See methodology.
The chart above ranks all seven English commissioning regions on the measures asked of adults who had an appointment. Six of them sit within 3.0pp of each other on the share rating overall experience "good", from 70.2% to 73.2%. The South West sits 9.4pp below the next lowest of those six.
London has the highest non-user share of the seven regions and the best experience for those who do use it
London has the highest share of adults who have never tried NHS dentistry, at 36.6%, and the best figures of the seven regions on the measures asked of adults who do use it. 81.4% of Londoners who tried got an appointment, the highest of the seven, and 7.2% rated that appointment "very poor", the fewest of the seven regions.
Its share rating overall experience "good" is 72.6%, second only to the Midlands at 73.2%. Among Londoners who had not tried in the last two years, 22.5% chose "haven't needed to visit" and 7.1% chose "NHS dental care too expensive". Londoners who stay away are the most likely of the seven regions to give either reason.
The share of adults who have never tried NHS dentistry rose in every region, London highest
Show data table
| Category | 2024 | 2025 |
|---|---|---|
| East of England | 26.2 | 27.7 |
| London | 35.5 | 36.6 |
| Midlands | 25.2 | 27.1 |
| NE & Yorkshire | 23.1 | 24.4 |
| North West | 24.1 | 25.5 |
| South East | 31.1 | 31.9 |
| South West | 26.2 | 27.8 |
36.6% of adults in London had never tried to get an NHS dental appointment, against 31.9% in the South East, the next highest region, a difference of 4.7 percentage points. The share rose in all seven regions in 2025, the Midlands most of all at 1.9pp. Source: GP Patient Survey 2024 to 2025, % of respondents who have never tried NHS dentistry, by NHS commissioning region
Two regions pose opposite questions, split by 13.0pp on "very poor" ratings. In the South West, adults who use NHS dentistry rate it lowest of the seven regions and are least likely of the seven to get an appointment, and both gaps widened between 2024 and 2025. In London, adults rate it among the best of the seven, and 36.6% have never tried it.
For commissioners, the South West question is about service quality, where only 66.3% of those who tried got an appointment; the London question is about reach, where 36.6% have never tried at all.
06
Thirteen of the fifteen headline measures moved significantly in 2025
Every headline dental measure in the GP Patient Survey, 2024 against 2025. Per Rare.Monitor's analysis, the largest single move in the survey was the 1.8pp rise in the share who tried for an NHS dental appointment and got one, to 78.1%, followed by the 1.6pp rise in the share rating overall experience "good", to 70.8%. Thirteen of the fifteen changes are statistically significant.
Whether adults have tried NHS dentistry
| Metric | Current | Change |
|---|---|---|
| Tried in the last two years | 51.2% | ↓ -1.2pp Significant |
| Never tried | 29.0% | ↑ +1.4pp Significant |
| Visited in the last three months | 19.9% | ↓ -0.7pp Significant |
Reasons given by adults who had not tried
| Metric | Current | Change |
|---|---|---|
| "Didn't think could get NHS appointment" | 26.1% | ↑ +1.4pp Significant |
| "Prefer to see a private dentist" | 26.7% | ↓ -0.1pp Not sig. |
| "Haven't needed to visit" | 18.8% | ↓ -1.0pp Significant |
| "On a waiting list" | 4.0% | ↑ +0.3pp Significant |
| "NHS dental care too expensive" | 5.6% | ↓ -0.1pp Not sig. |
Whether the attempt got an appointment
| Metric | Current | Change |
|---|---|---|
| Tried and got an appointment | 78.1% | ↑ +1.8pp Significant |
| "No, no appointments available" | 8.7% | ↓ -0.8pp Significant |
| "No, not taking new patients" | 10.5% | ↓ -0.6pp Significant |
How the appointment was rated
| Metric | Current | Change |
|---|---|---|
| Rated overall experience "good" | 70.8% | ↑ +1.6pp Significant |
| Rated the appointment "very good" | 42.0% | ↑ +1.4pp Significant |
| Rated the appointment "very poor" | 11.5% | ↓ -1.3pp Significant |
Returning to the same practice
| Metric | Current | Change |
|---|---|---|
| Would return to the same practice | 84.0% | ↓ -0.4pp Significant |
07
The ICS and PCN areas that moved most between 2024 and 2025
Per Rare.Monitor's analysis of the GP Patient Survey, the tables below show the largest movers between 2024 and 2025 on seven dental measures, at both ICS and PCN level. PCNs with fewer than 100 respondents in either year are excluded. These are the places to look at first when the 2026 figures arrive.
Two PCNs appear among the largest declines on more than one measure: Bournemouth East Collaborative and Moreton and Meols, on overall experience and on the share who got an appointment. Those are the networks to look at first when the 2026 figures arrive. Gloucestershire moved the other way, up 7.9pp on overall experience and 9.2pp on the share who got an appointment, with Kent and Medway up 3.9pp and 5.4pp. An ICS can move that far in a single year.
Frequently asked questions
Quick answers on the 2025 NHS dentistry figures: who has never tried, which region ranks lowest, which Integrated Care System areas moved most, and how ratings changed. Every answer draws on Rare.Monitor's read of the GP Patient Survey.
How many English adults have never tried NHS dentistry?
29.0% of adults in England had never tried to get an NHS dental appointment in 2025, per Rare.Monitor's read of the GP Patient Survey. That figure rose 1.4 percentage points from 27.6% in 2024, a statistically significant rise. These are adults who have never approached NHS dentistry, which is a different group from adults who tried and went private instead.Where is the NHS dentistry access gap widest in England?
The South West sits well below every other English region on quality and access, per Rare.Monitor's read of the GP Patient Survey. Its overall good rating (60.7%) trails the Midlands by 12.5pp; its success rate (66.3%) trails London's 81.4%; its very-poor share (20.2%) is more than double London's 7.2%. The gap widened between 2024 and 2025.Which Integrated Care System areas moved most between 2024 and 2025?
Per Rare.Monitor's read of the GP Patient Survey, on the share rating overall experience "good" the largest improvements were Gloucestershire, up 7.9 percentage points, and Norfolk and Waveney, up 5.6pp; Devon fell furthest, down 3.8pp. On the share choosing "on a waiting list" as a reason for not trying, the largest increases were Humber and North Yorkshire, and Lincolnshire, both up 2.2pp, followed by Lancashire and South Cumbria, up 1.8pp.What reasons do adults give for not trying NHS dentistry?
Adults who had not tried NHS dentistry in the last two years were asked why. In 2025, per Rare.Monitor's read of the GP Patient Survey, the two most-chosen reasons were "prefer to see a private dentist" at 26.7% and "didn't think could get NHS appointment" at 26.1%. Only the second rose, up 1.4 percentage points on 2024; preference for private was down 0.1pp and not statistically significant.How did patients rate NHS dental care in 2025?
Ratings of NHS dental appointments improved between 2024 and 2025, per Rare.Monitor's read of the GP Patient Survey. Among adults who had an appointment, 42.0% rated it "very good", up from 40.6%, a rise of 1.4 percentage points, and 11.5% rated it "very poor", down from 12.8%, a fall of 1.3pp. The share rating their overall experience of NHS dental services "good", which combines the "very good" and "fairly good" options, rose 1.6pp to 70.8% from 69.1%. The share who would return to the same practice fell from 84.4% to 84.0%, a fall of 0.4pp. "Fairly good" was flat at 28.8%.How does London differ from the rest of England on NHS dentistry?
London has both the highest never-tried share (36.6%) and the strongest experience metrics for its NHS users, per Rare.Monitor's read of the GP Patient Survey. Its 2025 success rate (81.4%) and overall good rating (72.6%) lead the country, while its very-poor share (7.2%) is the lowest. A small but well-served NHS base sits alongside a large non-engaged group.Did it get easier or harder to get an NHS dental appointment in 2025?
Two measures moved in opposite directions, per Rare.Monitor's read of the GP Patient Survey. Among adults who tried to get an NHS dental appointment, 78.1% got one, up 1.8 percentage points on 2024, and all three recorded reasons for being turned away fell. Among all adults, the share who had never tried rose 1.4pp to 29.0%, and among adults who had not tried in the last two years, the share choosing "didn't think could get NHS appointment" rose 1.4pp to 26.1%. What adults who tried experienced, and what adults who did not try believed was available to them, moved apart over the year.
Methodology
Primary data source: the GP Patient Survey, an independent national survey run on behalf of NHS England, asking respondents about their experiences of primary care including NHS dentistry. Register: public-health. It describes what patients experienced and what non-patients believed was available; it does not describe a commercial market. Waves compared: 2024 and 2025. Analysis by Rare.Monitor.
Measures used in this report, and what each one counts. "Tried in the last two years" and "never tried" come from the survey question on when the respondent last tried to get an NHS dental appointment, asked of all adults. The appointment success rate, described in the text as the share who got an appointment, is the "yes" answer to whether that attempt succeeded. It is asked only of adults who tried, and it is a share of those adults, not of all adults. Three reasons are recorded for a "no": no appointments available, the practice was not taking new patients, and another reason. Overall experience is rated on a five-point scale, "very good", "fairly good", "neither good nor poor", "fairly poor", "very poor", asked of adults who had an appointment, and "good" throughout this report combines "very good" and "fairly good". Reasons for not trying are asked only of adults who had not tried in the last two years, and respondents may choose more than one.
Two further shorthand terms recur. The non-user share is the share of all adults who have never tried to get an NHS dental appointment. A mover is a Primary Care Network (PCN) or Integrated Care System (ICS) area that appears among the five largest rises or the five largest falls on a given measure between the two waves.
Base sizes: approximately 294,000 to 690,000 respondents per dental question per year, as unweighted counts. National changes cited as significant use z-tests at 95% confidence unless otherwise noted. All year-on-year changes are stated in percentage points (pp), not as relative percentages. Every figure in every table in this report is rounded to one decimal place. Each stated change is calculated on the source figures before rounding and then rounded itself, so where it differs by 0.1pp from the difference between the two rounded figures shown on a row, the change calculated on the source figures is what governs.
Ranking within the mover tables is done on the unrounded change, never on the rounded figure shown in the Change column. Ranking on the rounded figure would drop areas that genuinely moved further than the ones listed, which would make a table labelled "largest declines" untrue. Once the five areas are chosen on the unrounded change, they are listed in order of the rounded change so the column reads in sequence. Two areas can therefore share a displayed change, and an area listed above another can show the same figure to one decimal place.
Geography rolls up from PCN to ICS to commissioning region, using standard ICS coding from the dataset. The source workbook already restricts PCN-level comparison to networks with at least 100 respondents in both years, and it carries PCN rows on that basis for all seven measures. Showing ICS-level movers only for three of them, on a waiting list, too expensive, and would return to the same practice, is an editorial choice to keep this section to a readable length. It is not a statistical limitation, and the underlying PCN rows for those three measures exist and can be published on request.
Two ICS areas, Surrey Heartlands and Sussex, changed Office for National Statistics (ONS) area code between the two waves. Their 2024 and 2025 boundaries are not directly comparable, so both areas are excluded from every year-on-year mover comparison in this report.
The PCN mover tables in this report run from 13.3 to 22.4 percentage points of single-year change; the ICS tables run from 0.2 to 9.2. Changes at the top of the PCN range are large for a one-year comparison. Some are real shifts, often coinciding with practice openings, closures, list changes or contract changes; some will be one-year fluctuations in who responded. The 2026 wave will help separate real change from single-year noise.
Related content
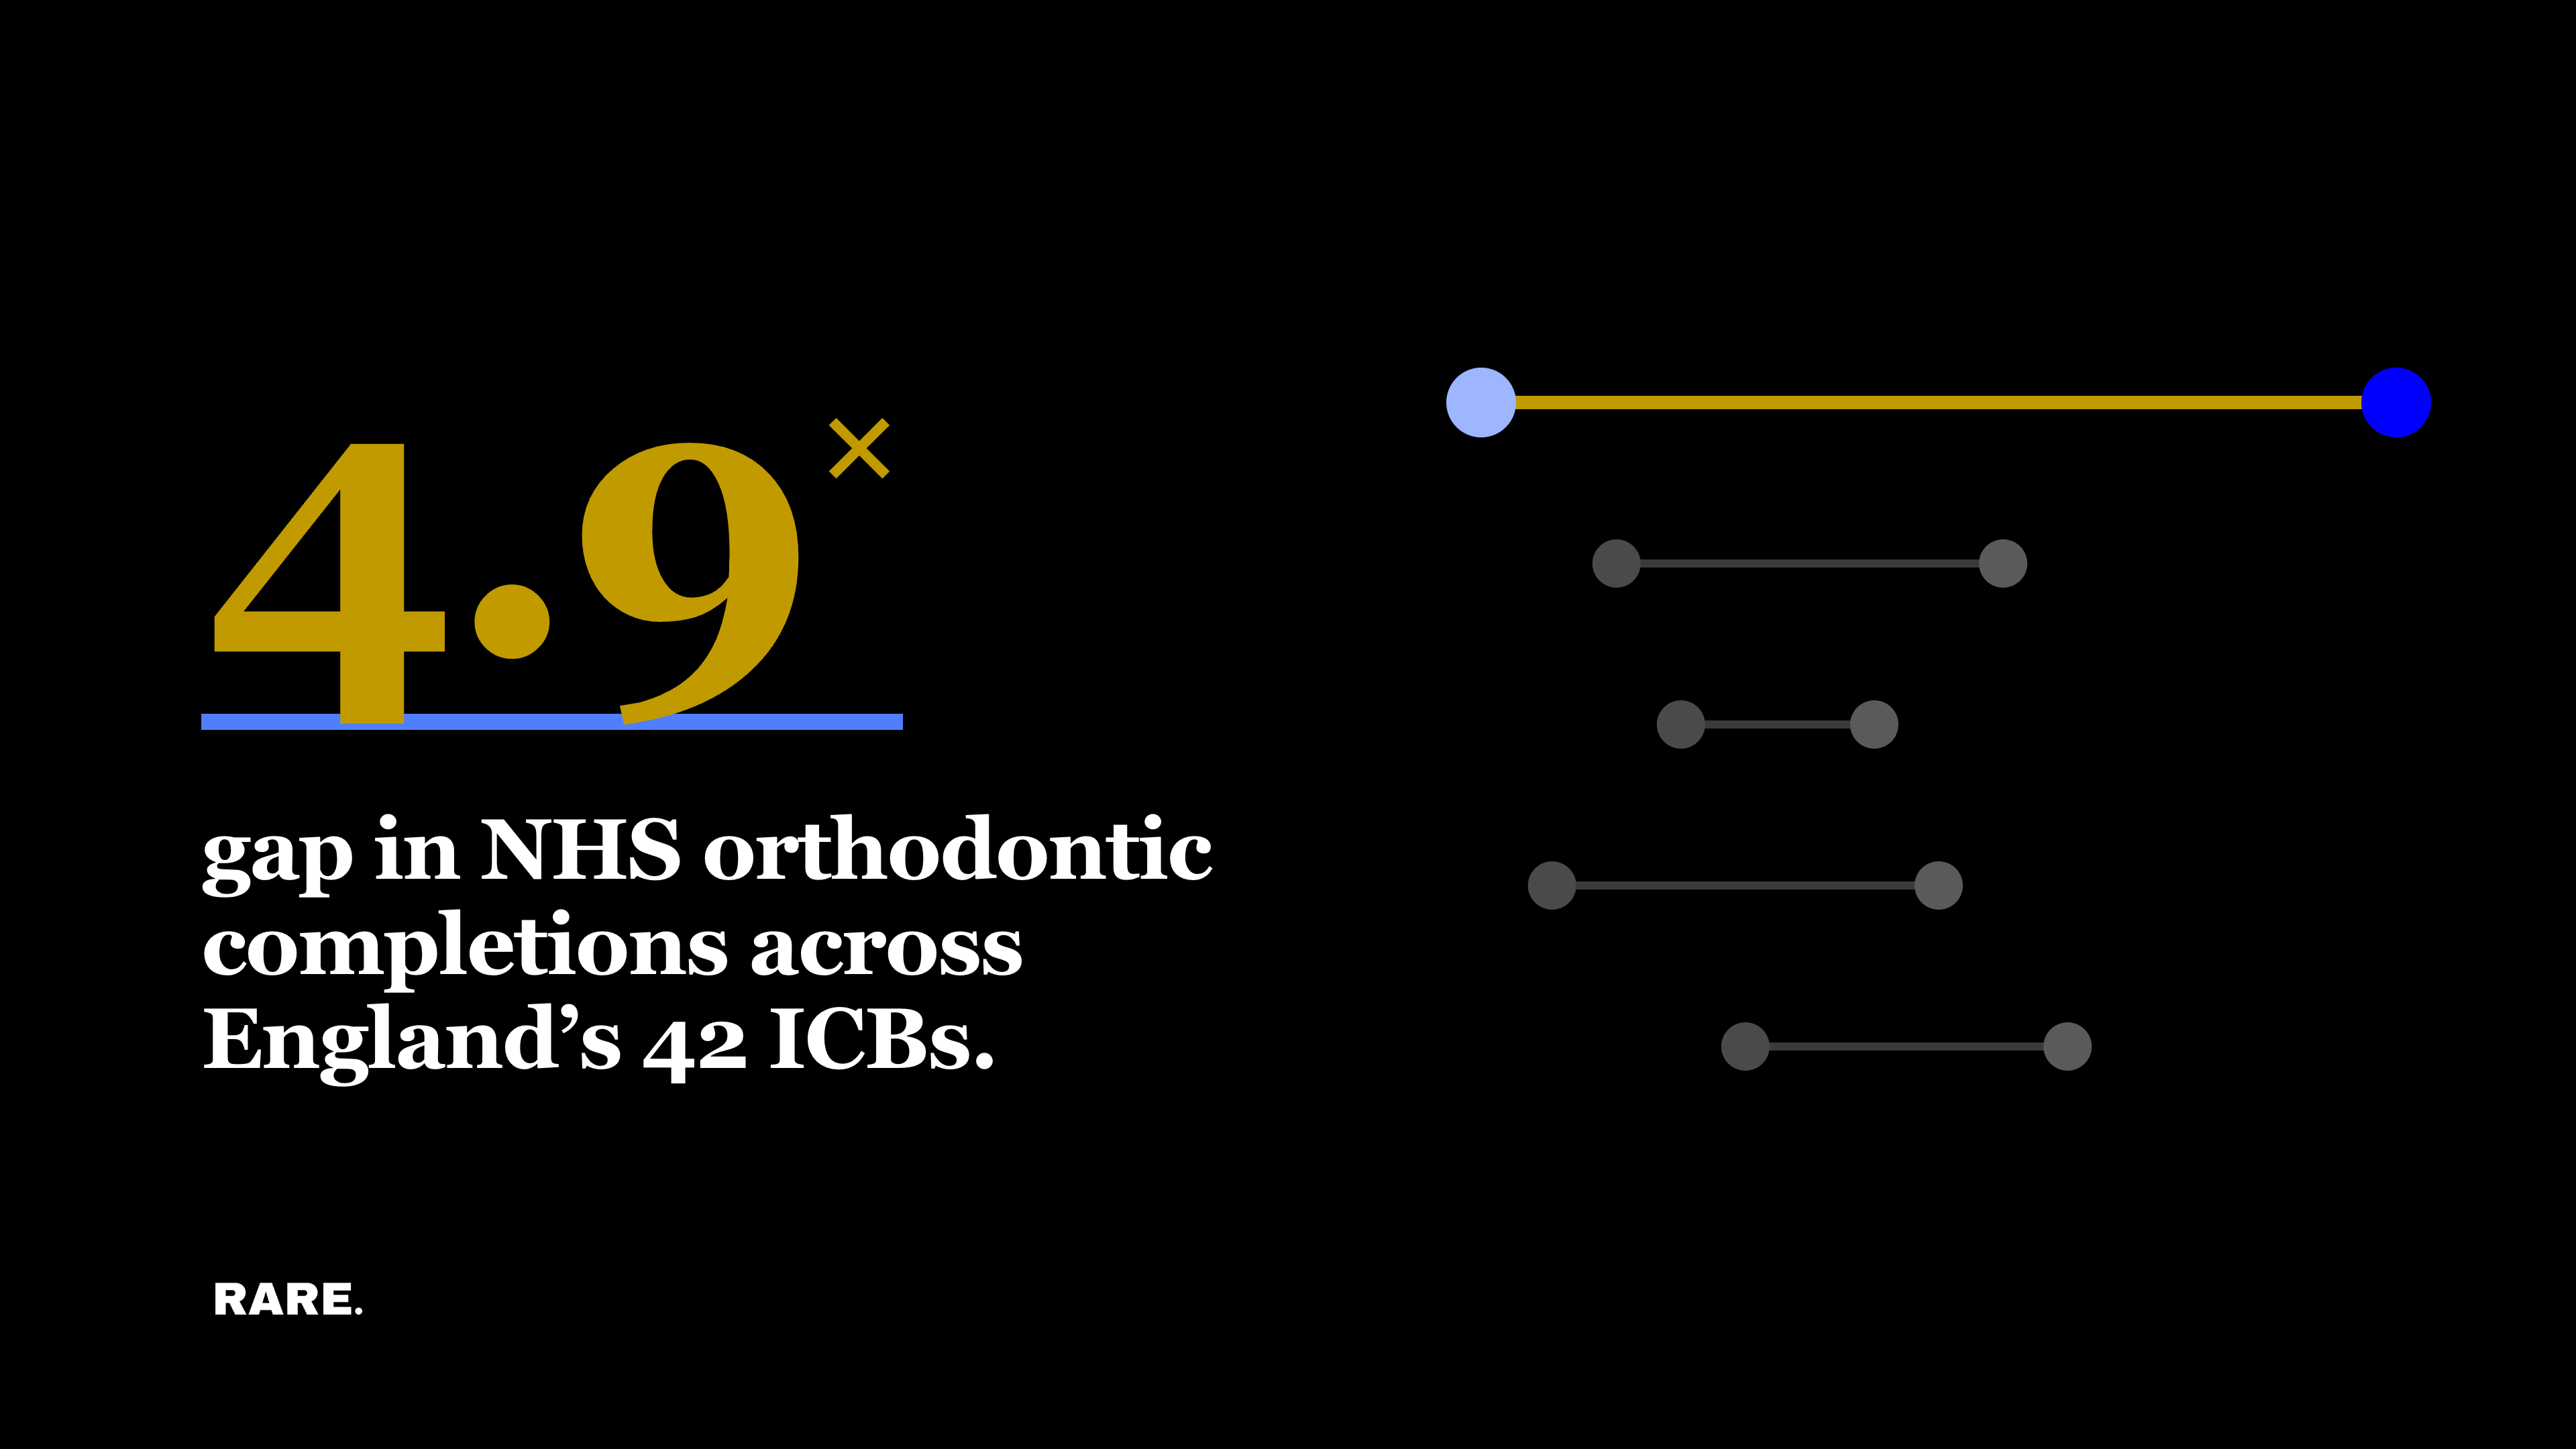
NHS orthodontic completion rates were higher in areas with lower health deprivation
Analysis of the English orthodontic market shows huge variation in case completion across English ICBs, and highlights that less health-deprived areas record more completed treatments per 100,000 people.
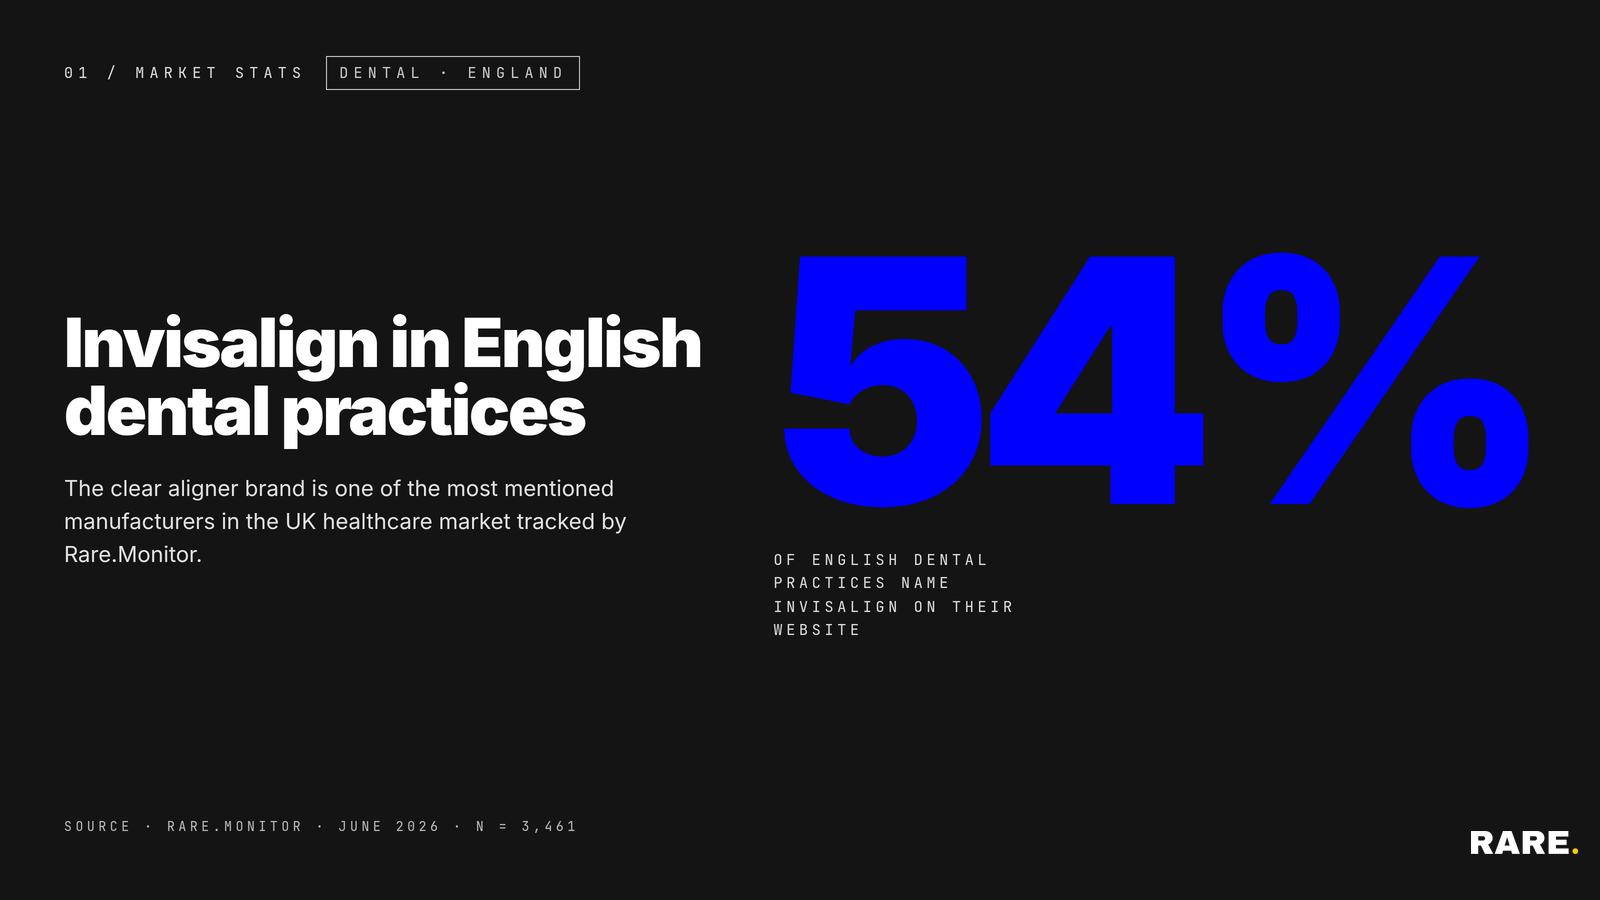
Invisalign in English dental practices, June 2026
54% of English dental practice websites name Invisalign, 1,879 of the 3,463 practices audited by Rare.Monitor in June 2026. Five English dental groups name the brand on every site indexed in that audit, and the rate runs from 65% in the West Midlands down to 33% in Cornwall and Isles of Scilly across the 33 ITL2 regions of England.
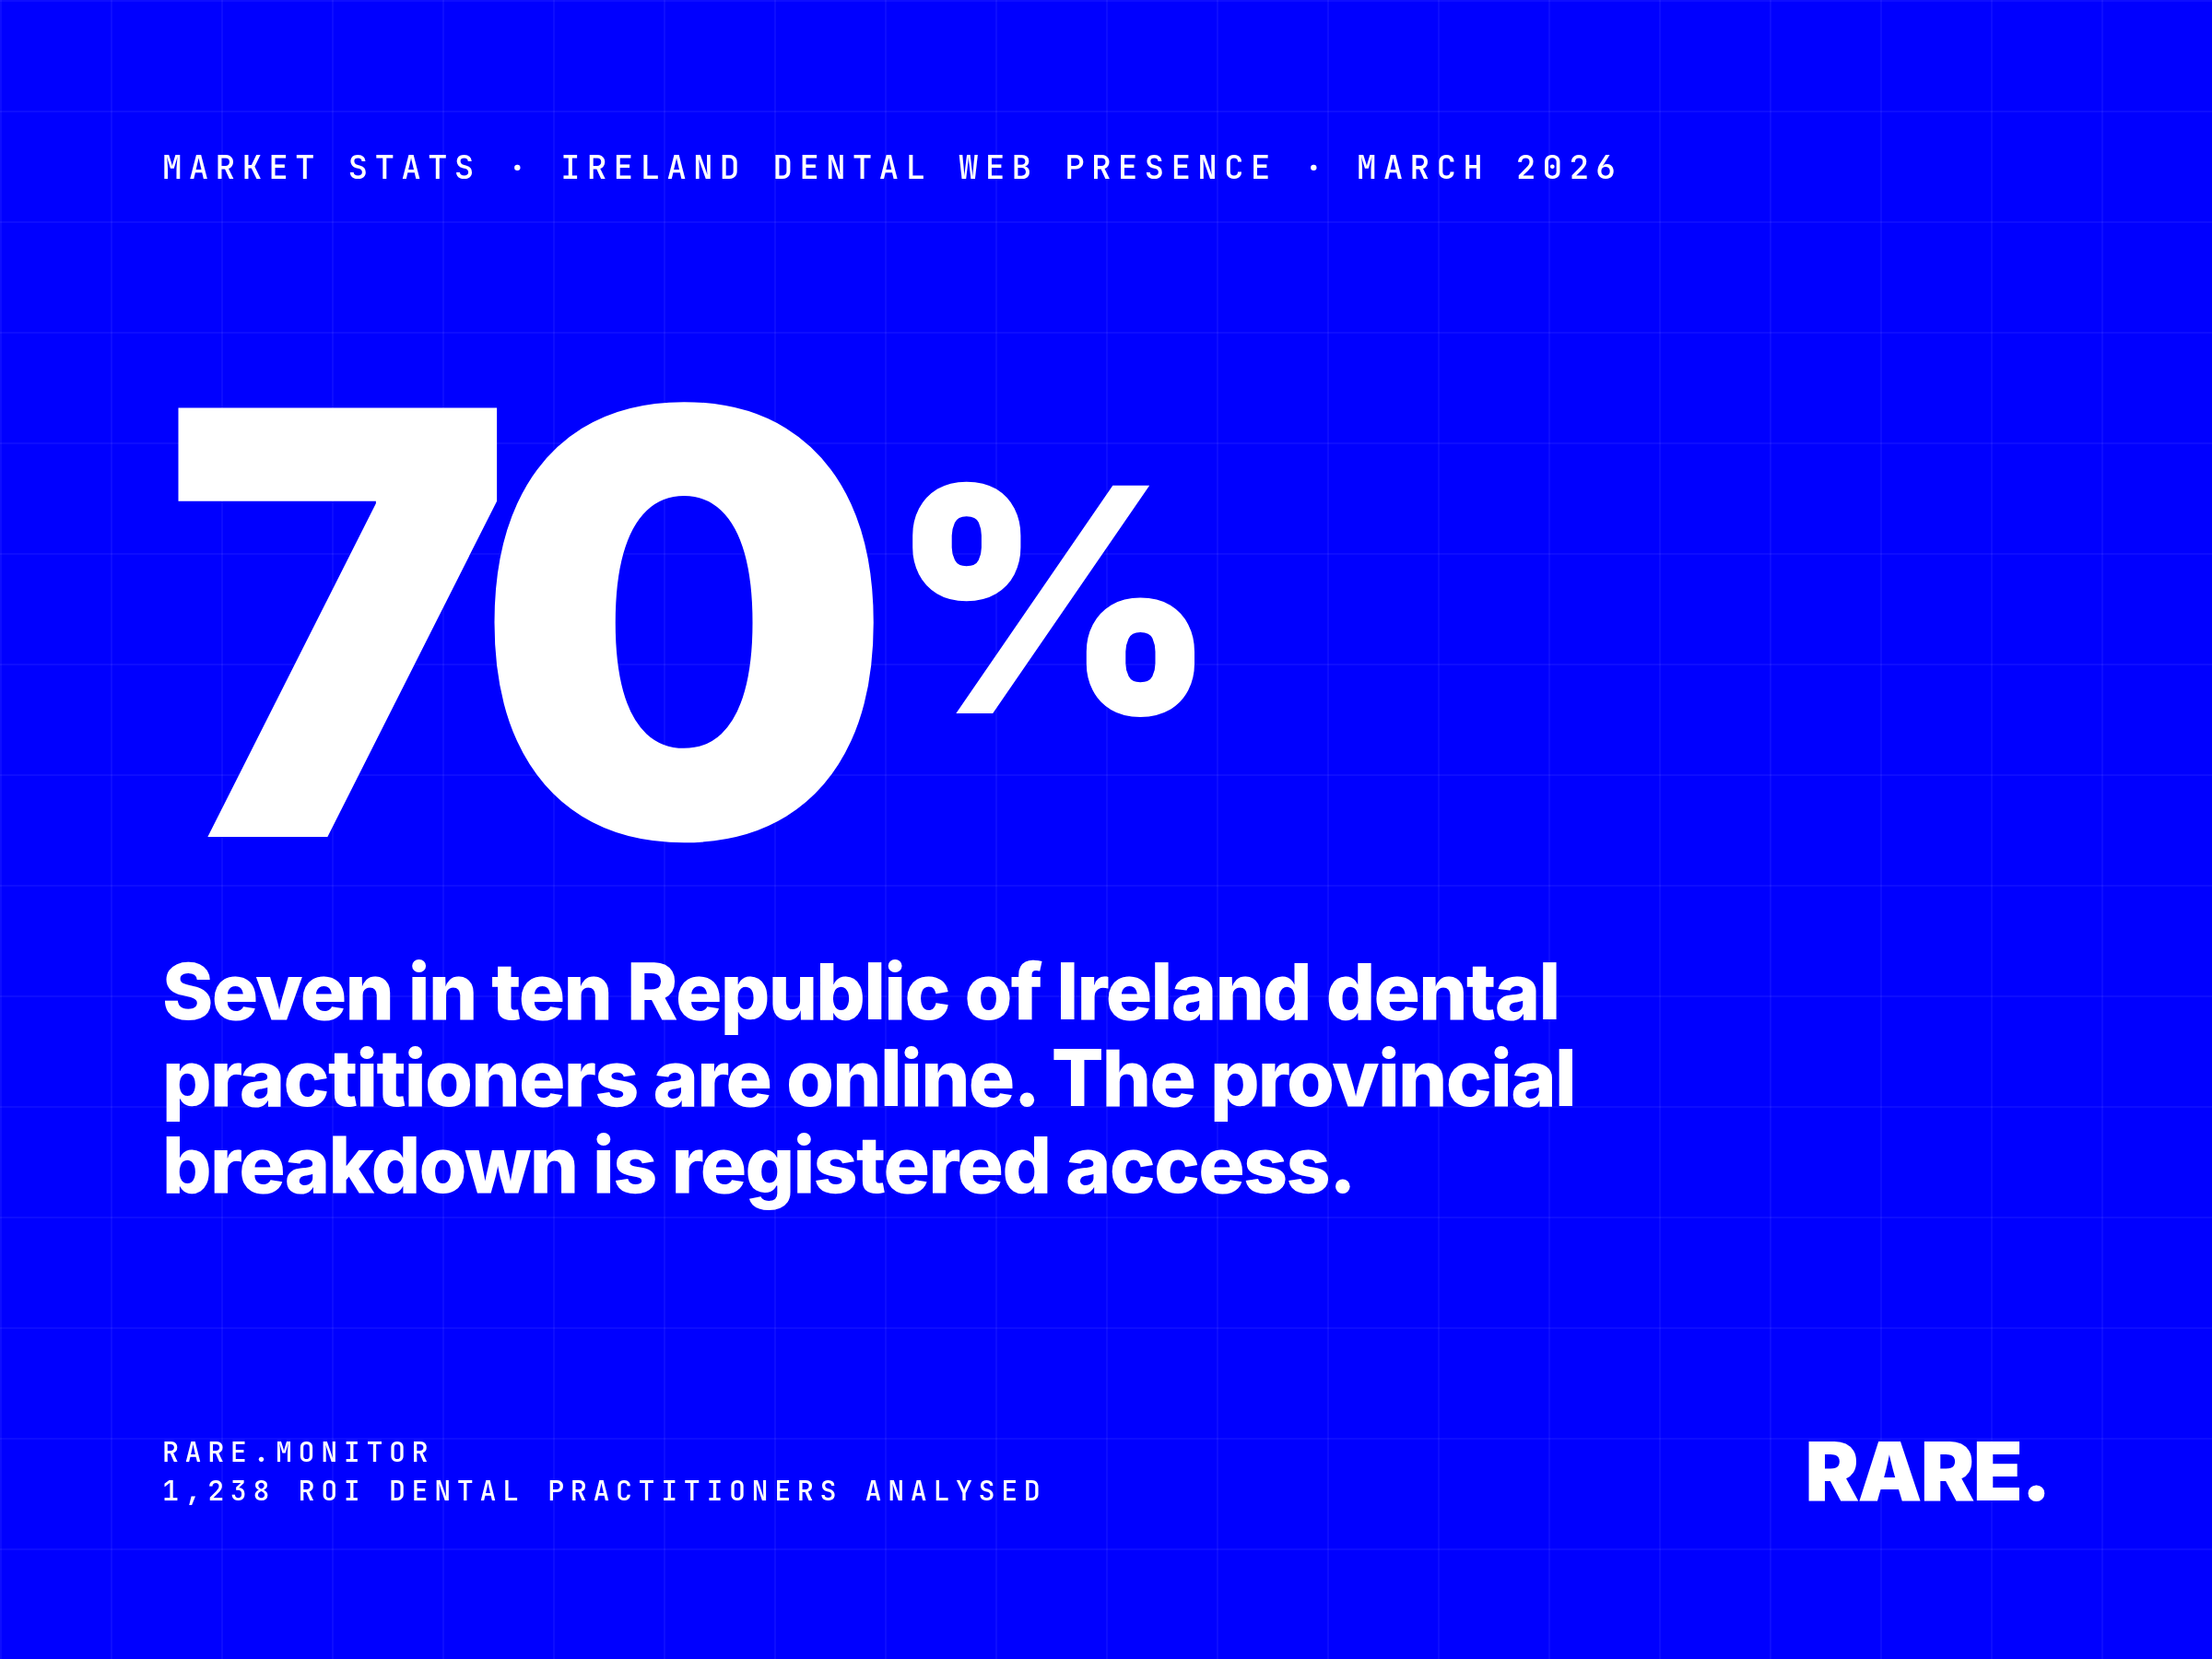
Ireland's Dental Practices: Web Presence Compared
70% of Republic of Ireland dental practitioners have an active website in March 2026, with 346 practitioners having no online presence at all. Adoption varies sharply by province, from 76.3% in Leinster to 58.7% in Ulster. Full provincial breakdown with free registration. Rare.Monitor analysis of 1,238 ROI dental practitioners.