
Deciding where England needs a new musculoskeletal clinic takes more than one metric. Put together how thinly physiotherapy is spread with how long people wait for NHS orthopaedic treatment, and ten NHS areas stand out. Lincolnshire stands out most: among the fewest clinics per head in the country, and among the longest waits.
Ten of England's 42 NHS areas show two signs of musculoskeletal strain at the same time: too few physiotherapy clinics for the size of the population, and long NHS waits for orthopaedic treatment. Most areas show one or the other. These ten show both, which is what makes them worth a closer look. Lincolnshire is the clearest case in the country.
Why one number isn't enough
Anyone deciding where to open a musculoskeletal clinic, or where the NHS most needs help, tends to reach for a single figure. Waiting times, usually. On its own, that figure misleads. A long wait can mean an area is genuinely short of provision, or it can mean a surgical backlog in an area that already has plenty of clinics. Those are different problems with different answers, and one number can't tell them apart. Our analysis of the market shows you need two at the very least.
The first is provision on the ground: how many physiotherapy and musculoskeletal clinics serve an area, measured per 10,000 residents so areas of different sizes compare fairly. Lincolnshire has 2.25 per 10,000 against an England average of 2.97. Fewer clinics per head means residents travel further and wait longer for private and community care.
The second is the NHS backlog: the median time patients wait for orthopaedic and rheumatology treatment, published in NHS England's Referral to Treatment statistics. Lincolnshire's median is 16.3 weeks against an England median of 12.0, and only 27% of its patients are treated within 18 weeks, against a national target of 92%.
Here's the key point. Across the 42 areas, these two measures barely track each other. An area can have plenty of clinics and long waits, or few clinics and short waits, or any mix. Because they measure genuinely different things, an area that scores badly on both isn't a quirk of one statistic. It's a place where clinic provision is thin and the NHS pathway is slow at the same time. That is where the case for a new clinic is strongest, and it's the test this analysis applies to all 42 areas.
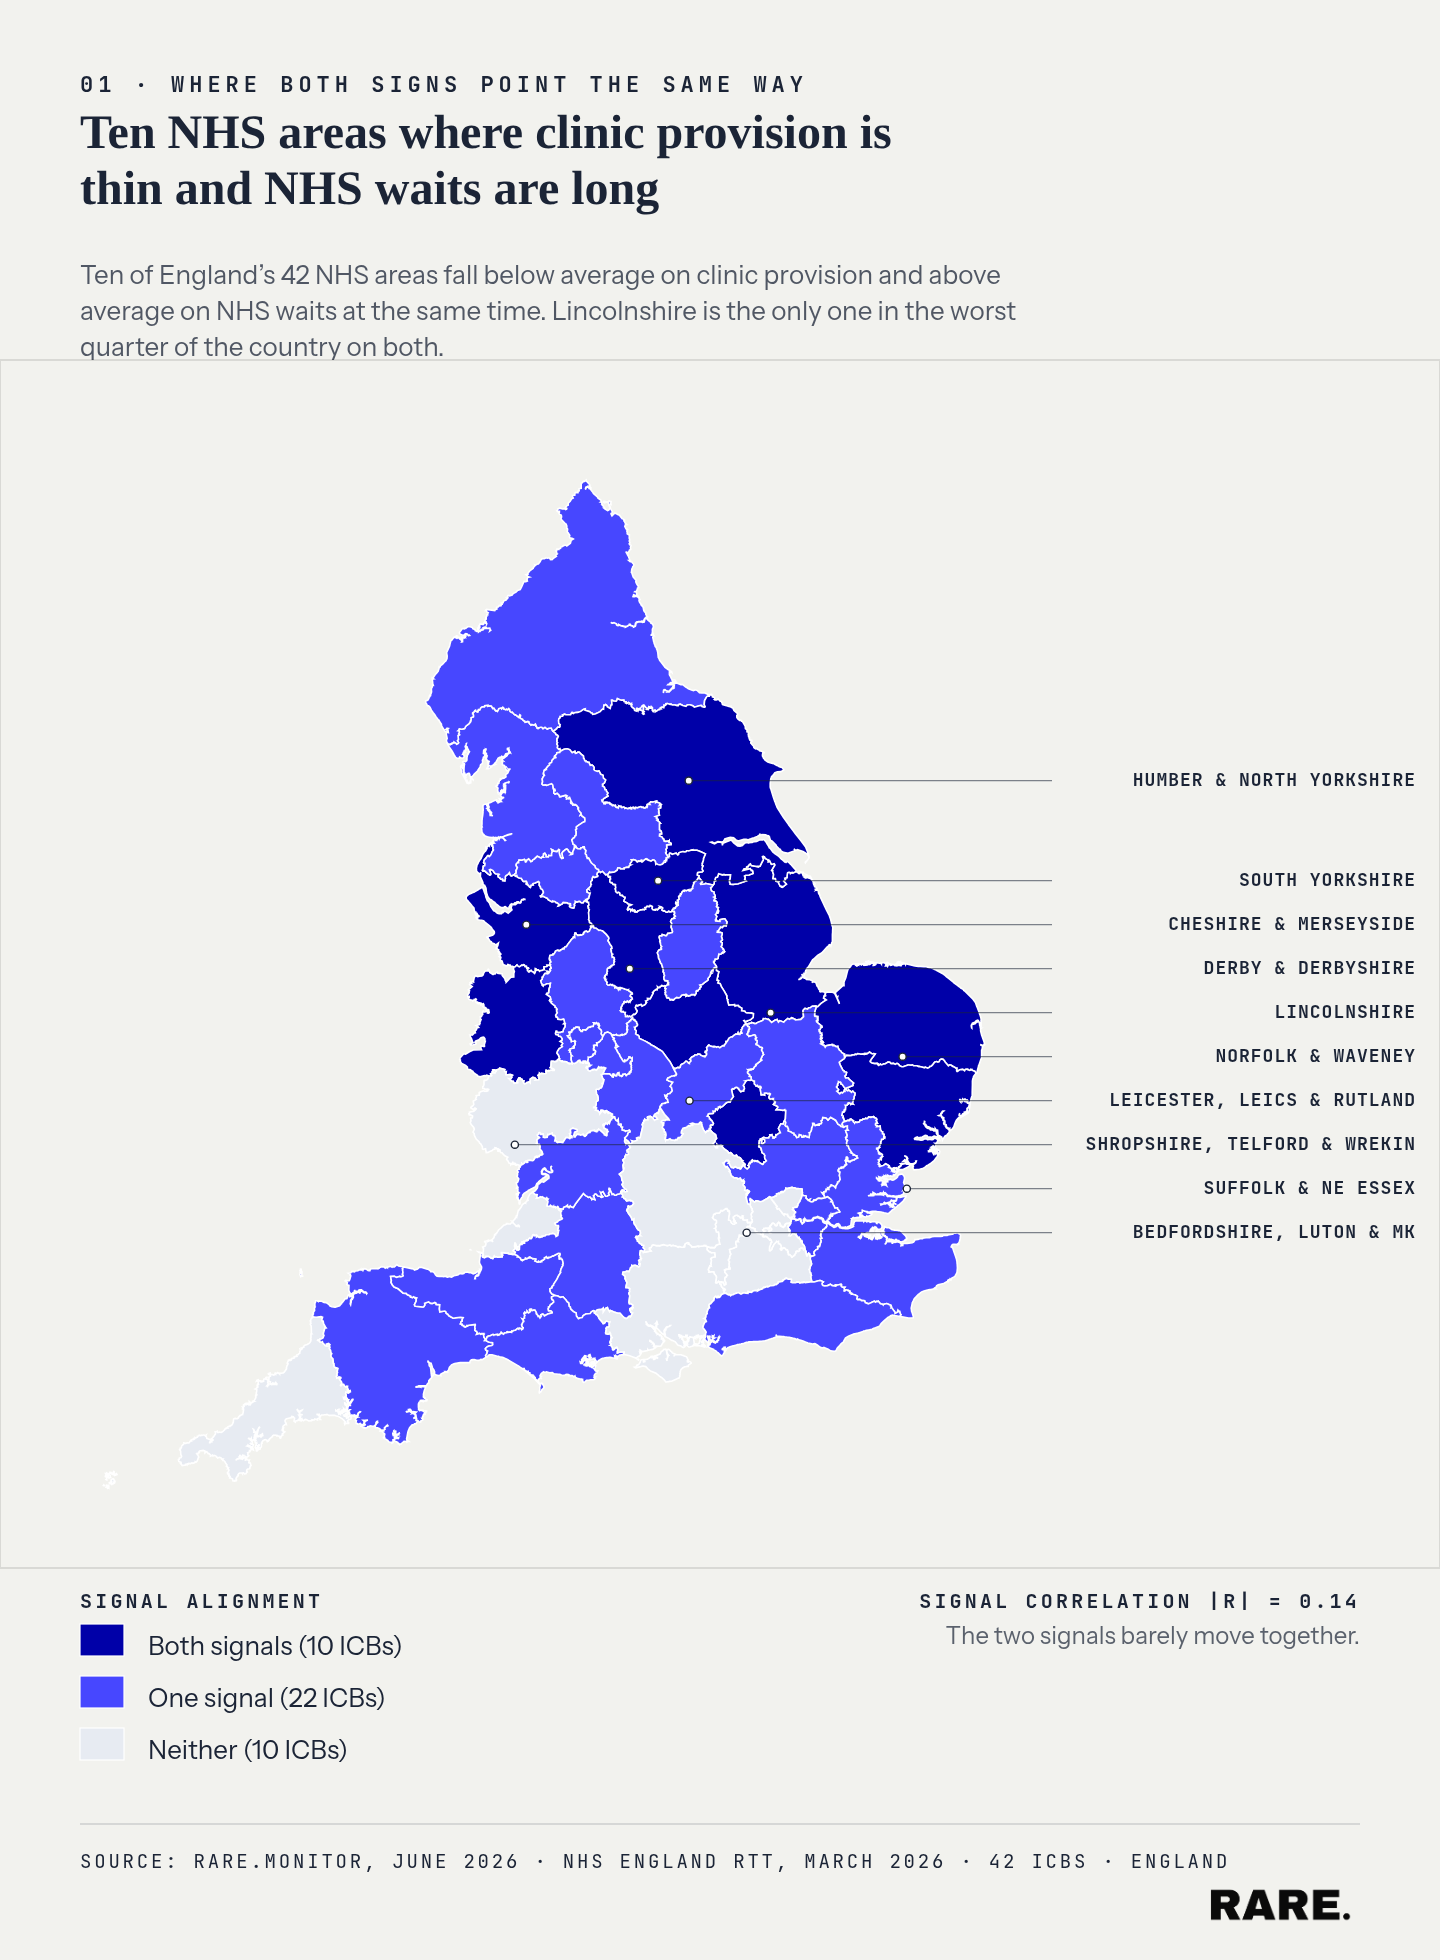
Ten NHS areas fall below average on clinic provision and above average on NHS waits at the same time. Lincolnshire is the only one in the worst quarter of the country on both.
The ten areas where both point the same way
Ten of the 42 areas fall into the worse-than-average group on both measures at once: below-average clinic provision and above-average NHS waits. Four of them are worse still, landing in the bottom quarter of the country on both. (These areas are formally Integrated Care Boards, or ICBs, the bodies that plan and buy NHS services locally.)
To rank them, we scored every area on each measure from best to worst, then averaged the two positions. An area near the top of that combined ranking is one of the worst places in England on clinic provision and NHS waits together.
The worst three:
Lincolnshire. 2.25 clinics per 10,000 residents and a median NHS wait of 16.3 weeks. The only area in the country in the bottom quarter on both.
Leicester, Leicestershire and Rutland. The longest median NHS orthopaedic wait in England at 21.3 weeks, with provision at 2.43 per 10,000.
Cheshire and Merseyside. 2.31 per 10,000 and a median wait of 14.1 weeks. The largest of the ten by population at 2.6 million residents, so the number of people affected is highest here.
The other seven in the same group: Derby and Derbyshire; Bedfordshire, Luton and Milton Keynes; South Yorkshire; Shropshire, Telford and Wrekin; Suffolk and North East Essex; Norfolk and Waveney; and Humber and North Yorkshire. They concentrate in the Midlands (four) and the East of England (three), with the rest in the North. For a team deciding where to expand, this is the shortlist: ten areas where the pressure shows up on two independent measures, not one.
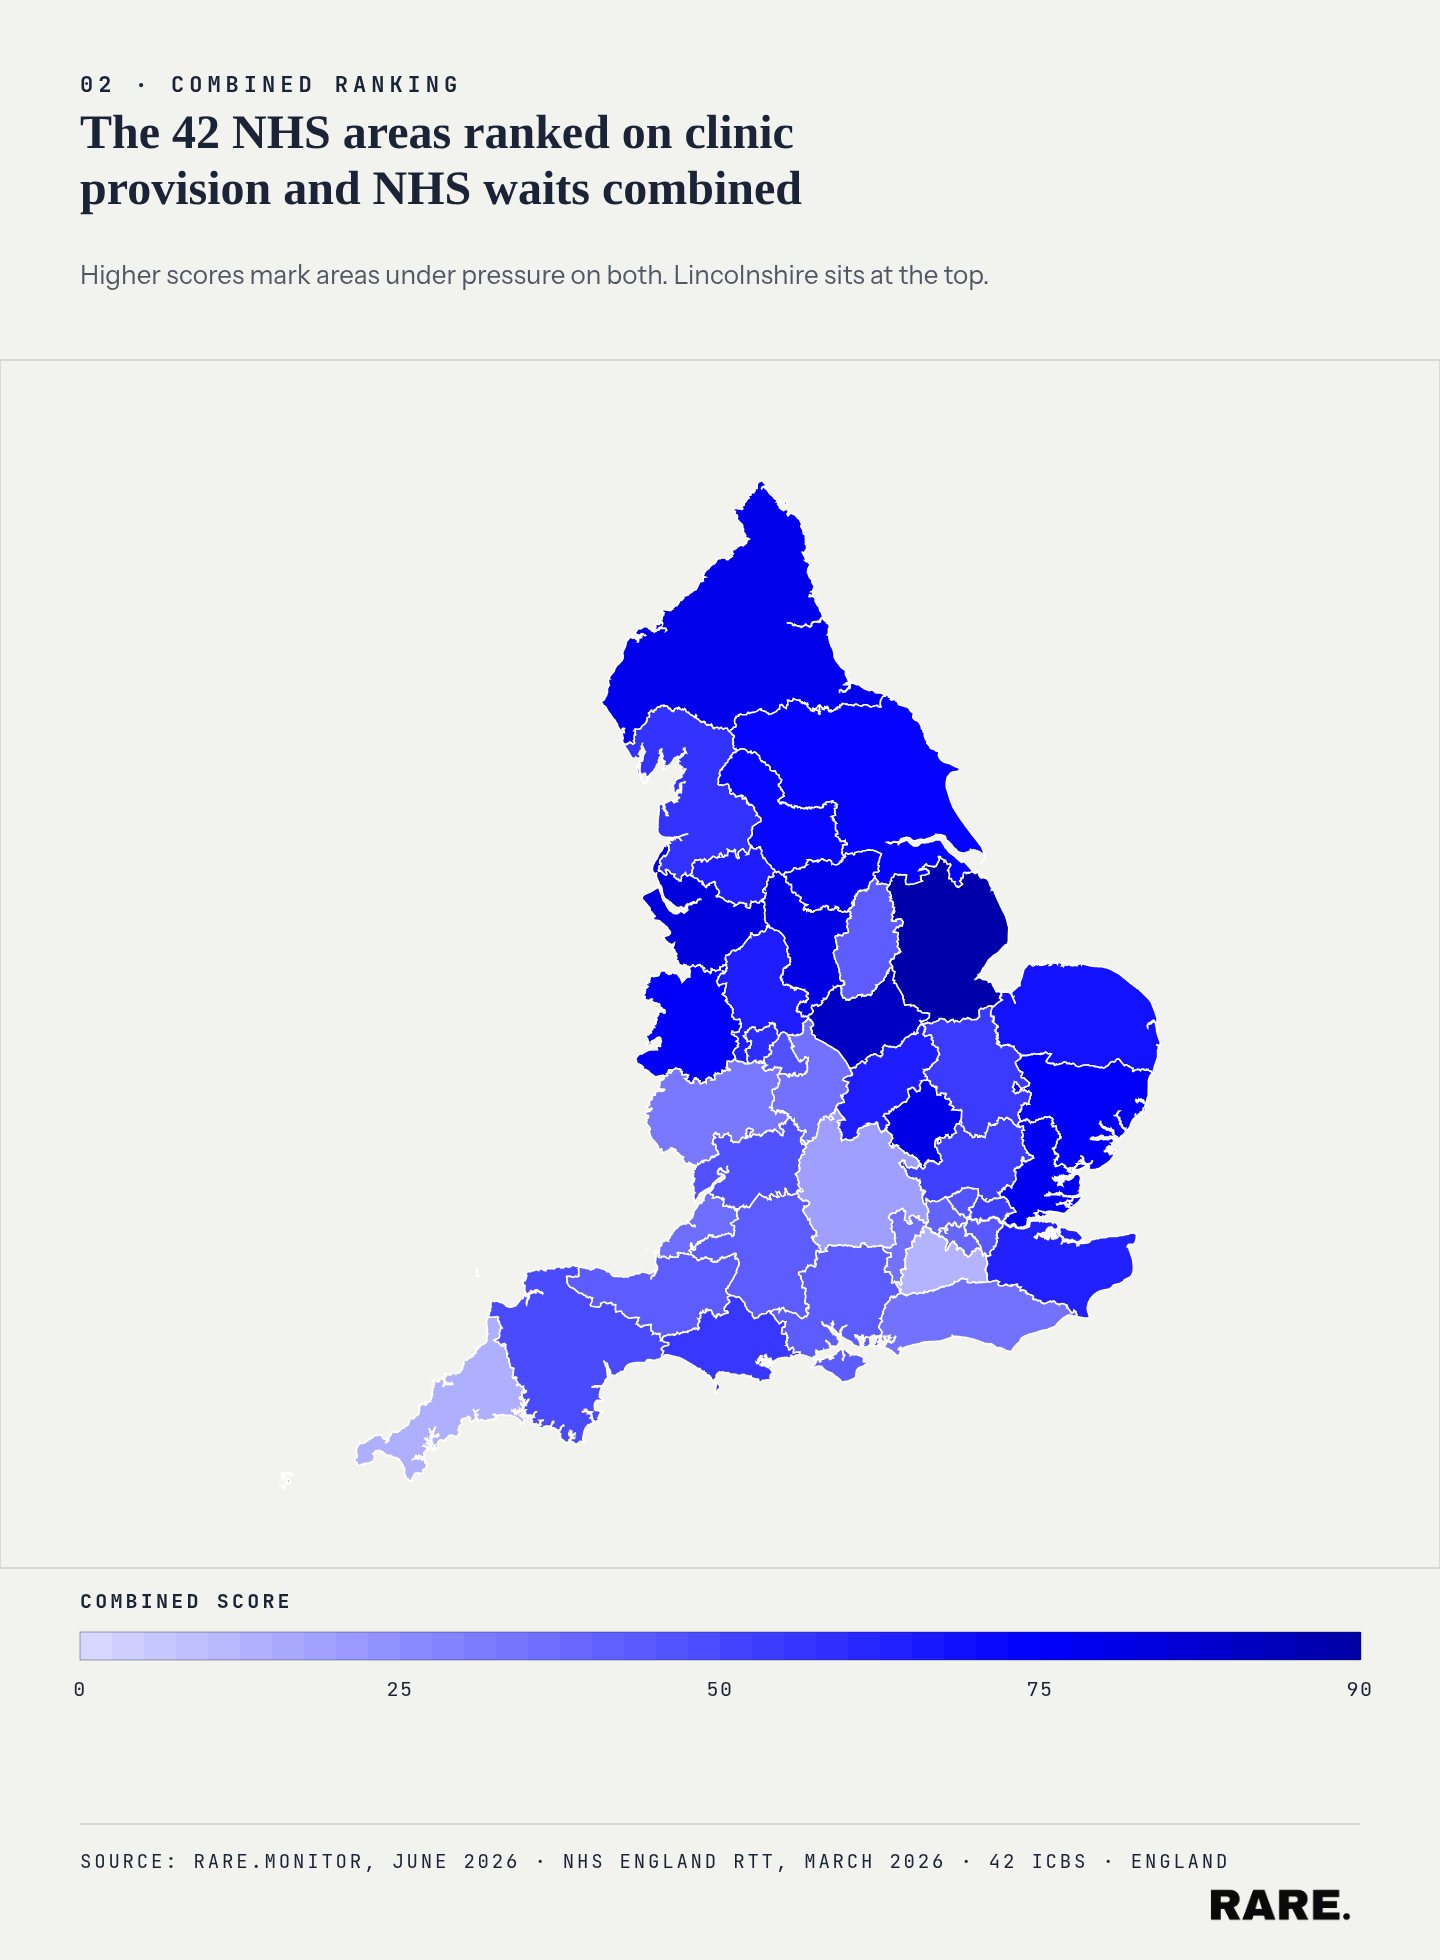
The 42 areas ranked on clinic provision and NHS waits combined. Higher scores mark areas under pressure on both. Lincolnshire sits at the top.
Lincolnshire: the clearest case
One area stands on its own. Lincolnshire has among the fewest MSK clinics per head in England and among the longest NHS waits, and no other area combines the two to the same degree.
The detail: 178 physiotherapy and musculoskeletal locations for a population of roughly 790,000. That works out at 2.25 per 10,000 residents against a national average of 2.97. The median NHS wait for orthopaedic and rheumatology treatment is 16.3 weeks against an England median of 12.0. Only 27% of Lincolnshire's orthopaedic patients are treated within 18 weeks, when the target is 92%.
Thin provision and long waits usually point in different directions. In Lincolnshire they point the same way, which is what makes it the strongest case in the country for adding capacity.
Two areas that one measure alone gets wrong
The reason to use two measures instead of one shows up clearly in two areas that score high on a single measure but not the other. Read either on its own and you would draw the wrong conclusion.
Mid and South Essex has the highest number of patients in England waiting more than 78 weeks for orthopaedic treatment, at 433, and a median wait of 19.0 weeks. Look only at waits and it lands near the top of the list. But its clinic provision is 3.16 per 10,000, close to the national average. This is a surgical backlog, not a shortage of clinics. Opening more MSK clinics here would not fix the problem the wait figure is flagging.
North East and North Cumbria is the reverse. Clinic provision is thin at 1.65 per 10,000, well below the national average, across a population of 3 million. Yet its median NHS wait is 11.9 weeks, close to average, and 61% of patients are treated within 18 weeks. Thin provision here is not yet showing up as long NHS waits. That could mean local demand has not reached the NHS orthopaedic pathway, or that providers are keeping pace despite the thin coverage. Both fit the data, so this is one to watch rather than a clear case. Staffordshire and Stoke-on-Trent follows a similar pattern on a smaller scale (1.88 per 10,000, median wait 10.7 weeks).
The point is not to rule either area out. It is to read each one correctly. Combining the two measures separates a surgical backlog from a genuine provision gap, and finds the places where both hit at once.
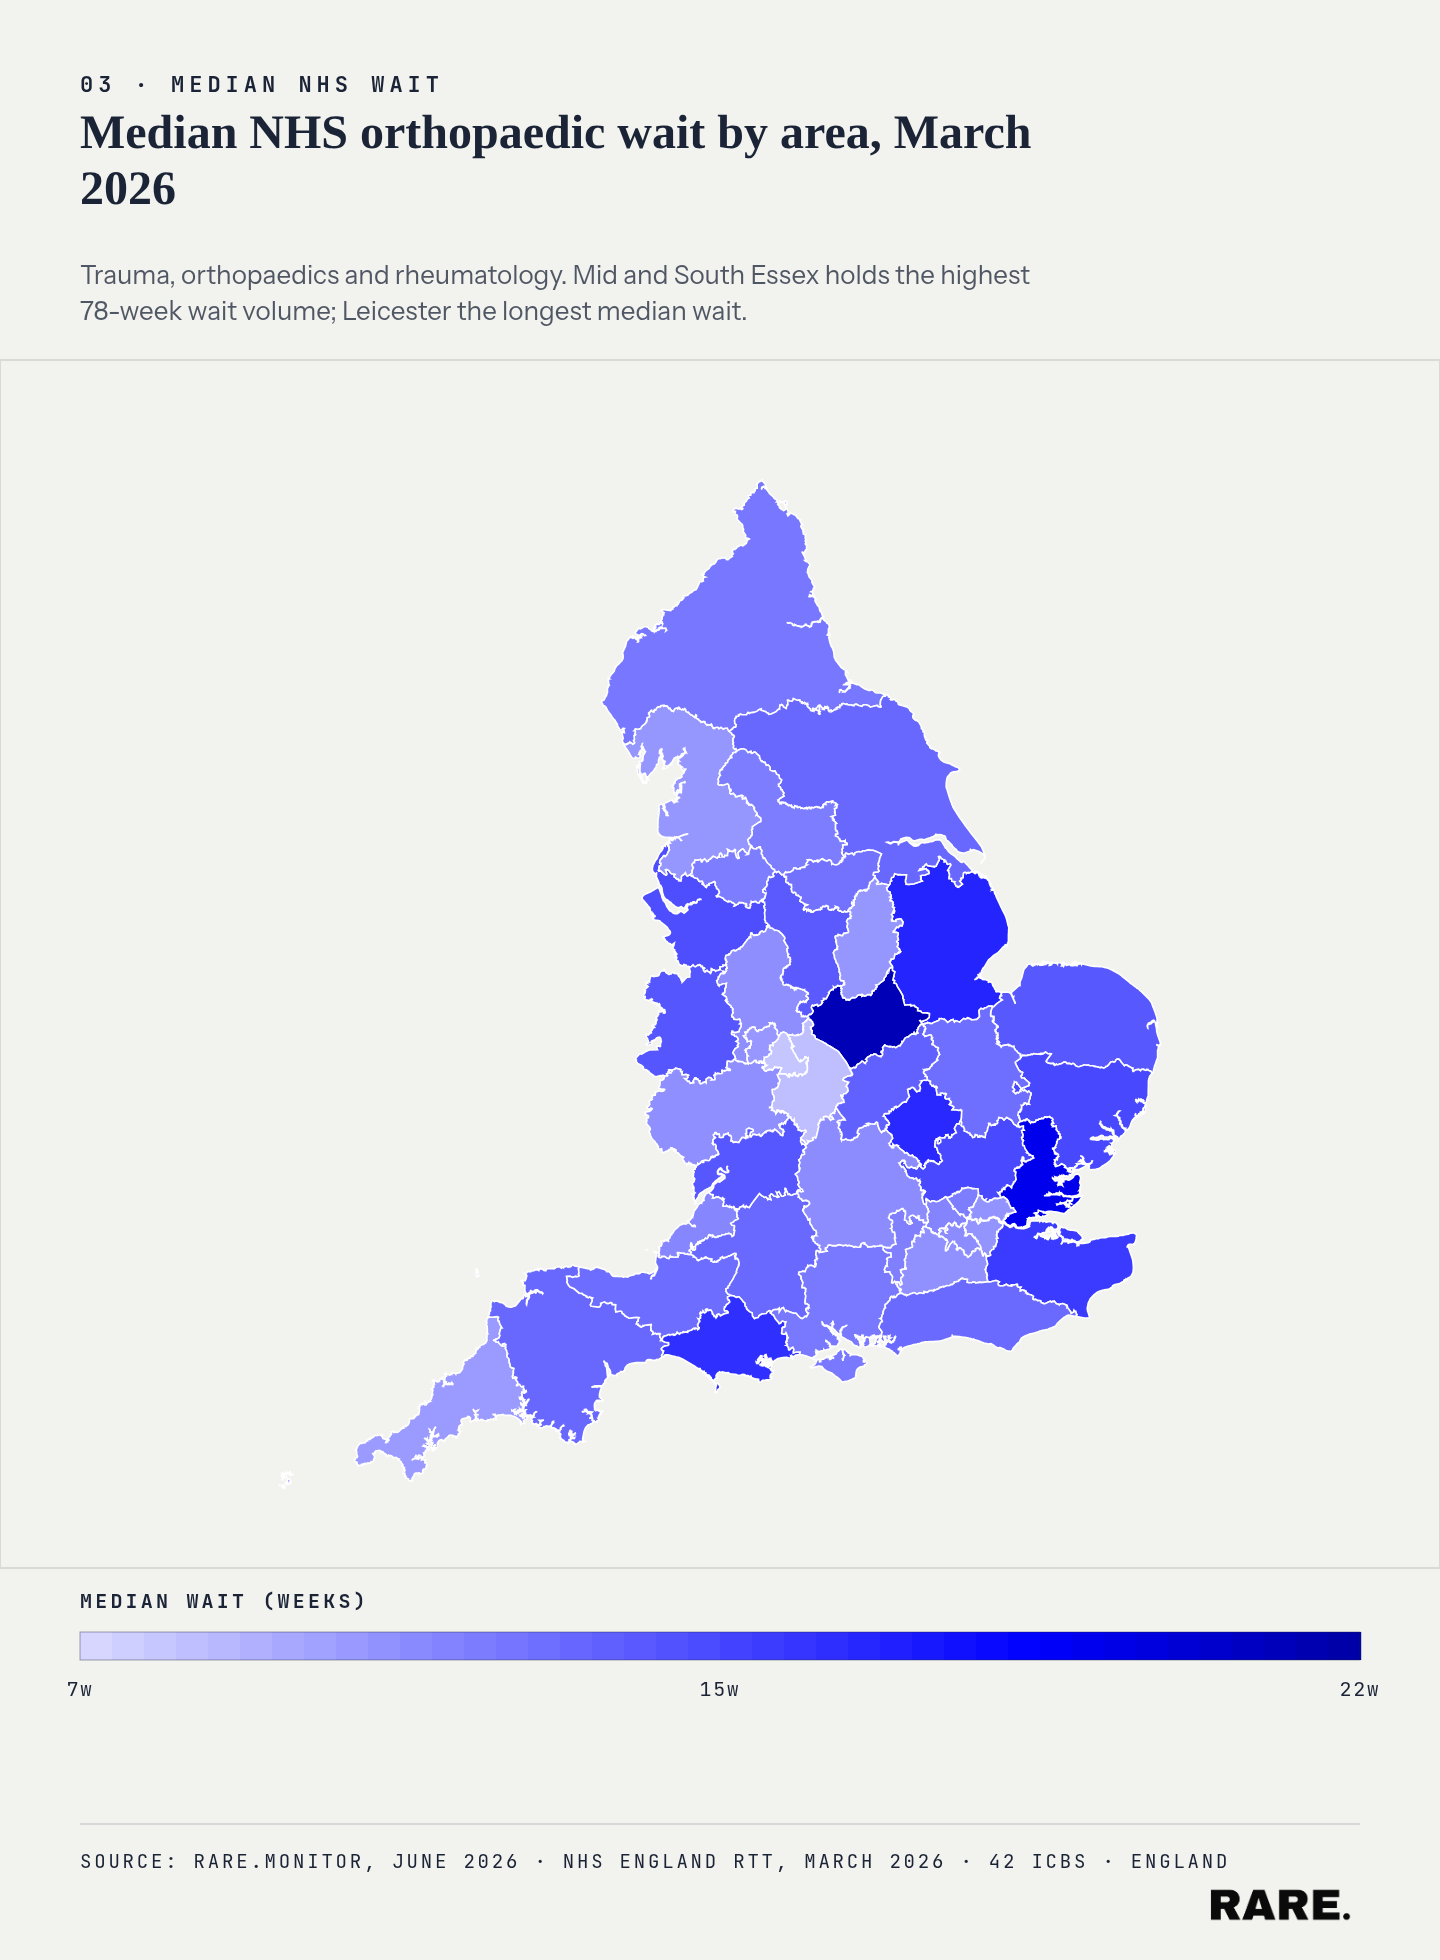
Median NHS wait for trauma, orthopaedics and rheumatology by area, March 2026. Mid and South Essex holds the highest 78-week wait volume; Leicester the longest median wait.
What this analysis can't tell you
A few limits worth stating plainly.
The provision figure counts physiotherapy and MSK locations. It measures how many clinics exist, not how large they are, how many staff they hold, or how quickly they see people. Two areas with the same figure can look very different on the ground.
The wait figure covers two NHS treatment types: trauma and orthopaedics, and rheumatology. It does not cover community physiotherapy waits, which were dropped from national NHS reporting in February 2024 and so are not visible here.
The wait figure also covers only NHS-funded treatment. Patients who go fully private do not appear in it, so areas with heavy private demand may look less pressured than they are.
Finally, NHS areas are large. A single area figure can hide wide variation between the towns inside it.
Ten areas, one shortlist
Read either measure on its own and you get a plausible but unreliable list. Read them together and the list gets shorter and easier to defend: ten areas where thin clinic provision and slow NHS treatment show up at the same time, and one, Lincolnshire, where both are as bad as they get. For anyone weighing where new musculoskeletal capacity would do the most good, that overlap is the place to start.
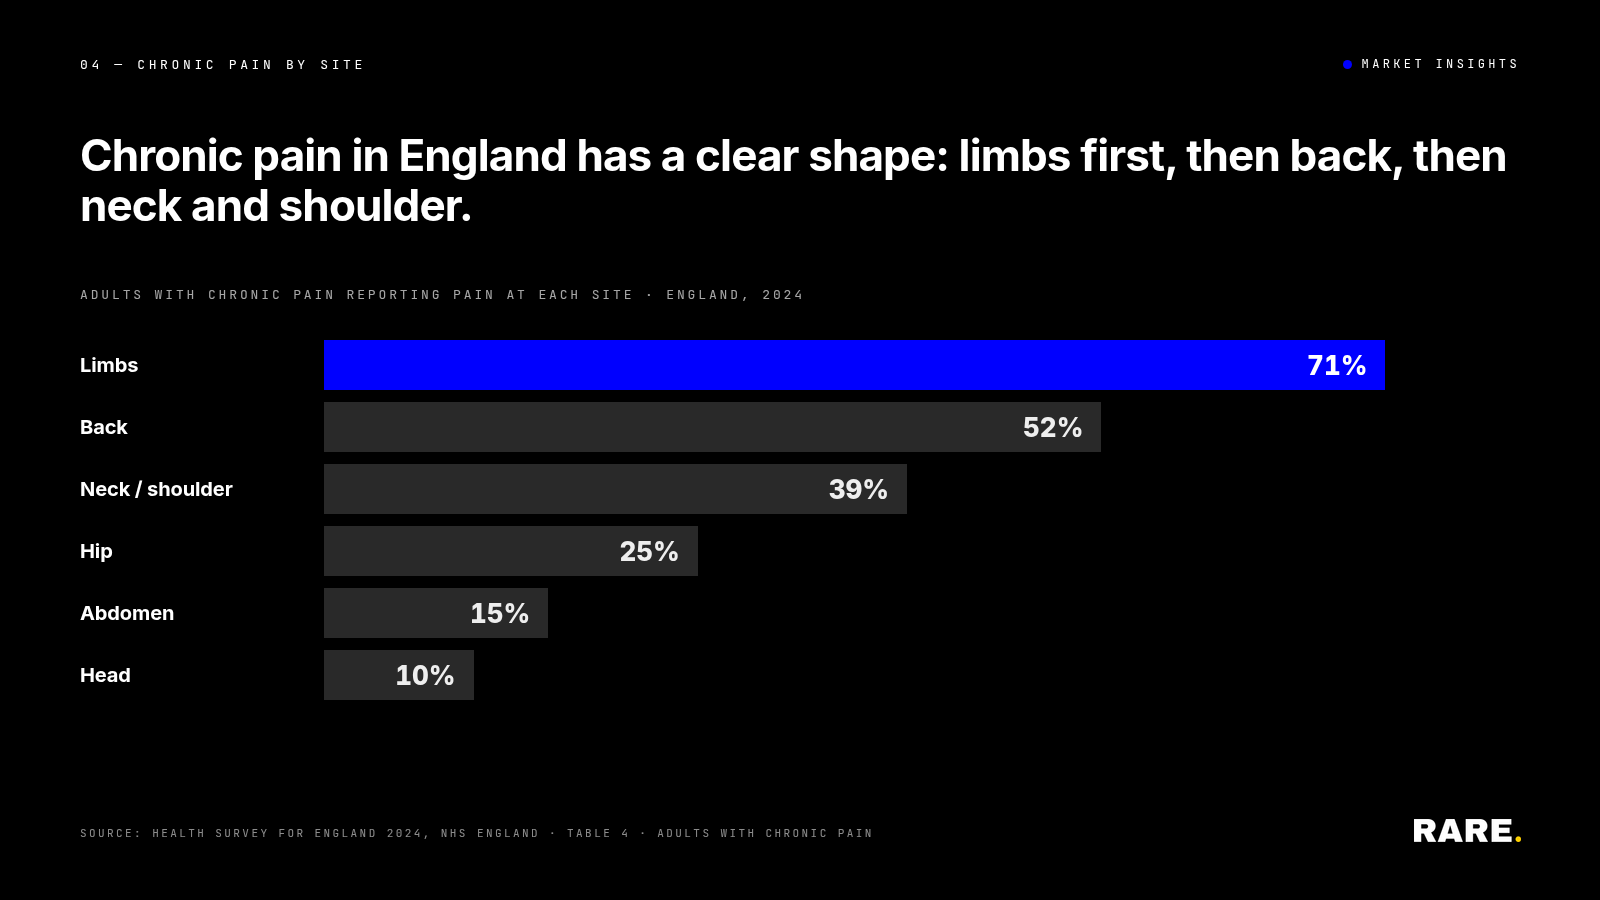
Related: for the underlying population picture of where musculoskeletal burden falls across England, see our analysis of chronic pain in England by site.
Methodology: Clinic provision is derived from Rare.Monitor's enricher dataset of UK physiotherapy and musculoskeletal locations, geocoded to NHS Integrated Care Board by postcode and expressed per 10,000 residents using ONS mid-year population estimates. NHS waits are from NHS England's Referral to Treatment statistics, incomplete-pathway data for Treatment Function Codes 110 (trauma and orthopaedics) and 410 (rheumatology), March 2026. Each area's median is the mean of provider-level medians, with providers assigned by primary commissioner. The combined priority score is the equal-weighted average of each area's percentile rank on provision and on waits. The two measures correlate weakly across the 42 areas (|r| = 0.14). Community physiotherapy waits fall outside these statistics following the removal of Treatment Function Code 650 from national reporting in February 2024. GP Patient Survey prevalence is not used. 42 English Integrated Care Boards in scope. Source: Rare.Monitor, June 2026; NHS England Referral to Treatment statistics, March 2026.